
Week of April 25, 2022 in Review
Inflation and housing data dominated the headlines, with these key stories:
Consumer Inflation Reaches 40-year High
What’s the bottom line? Not only does inflation lead to higher costs of goods, but it is also the arch enemy of fixed investments like Mortgage Bonds because it erodes the buying power of a Bond’s fixed rate of return. If inflation is rising, investors demand a rate of return to combat the faster pace of erosion due to inflation, causing interest rates to rise as we’ve seen this year. This week’s Fed meeting will be crucial as investors will be closely watching what actions the Fed will take to address rising inflation.
Annual Home Price Appreciation Nears 20% in February
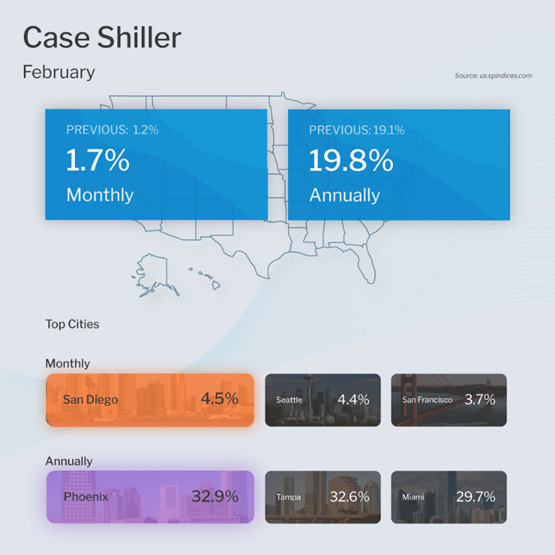
The Case-Shiller Home Price Index, which is considered the “gold standard” for appreciation, showed home prices rose 1.7% in February and 19.8% year over year. This annual reading is up from the 19.1% gain seen in the previous report.
The Federal Housing Finance Agency (FHFA) also released their House Price Index. This report measures home price appreciation on single-family homes with conforming loan amounts, which means it most likely represents lower-priced homes where supply has been tight and demand strong. Home prices rose 2.1% in February and were up 19.4% year over year, which is an increase from the 18.2% rise reported for January.
What’s the bottom line? Despite ongoing reports from the media that a housing bubble is ahead, we continue to see high levels of appreciation even in the face of higher mortgage rates. And while 20% annual home price appreciation may not continue, the ongoing dynamic of high demand and low supply means homes should still appreciate in the mid to high single digits, which is a healthy level.
The Real Scoop on New Home Inventory
New Home Sales, which measures signed contracts on new homes, were down 8.6% from February to March to a 763,000-unit annualized pace. However, this headline figure is less negative than the media would lead you to believe, given that there was an 8% positive revision to February’s data.
What’s the bottom line? Looking at inventory, there were 407,000 homes for sale at the end of March, which equates to a 6.4 months’ supply. But of the 407,000 homes for sale, only 35,000 or 9% are actually completed. The rest are either not started or under construction. When we factor in the homes that buyers could actually move into today, inventory is closer to about half a month’s supply.
Pending Home Sales Decline But Still Strong Overall
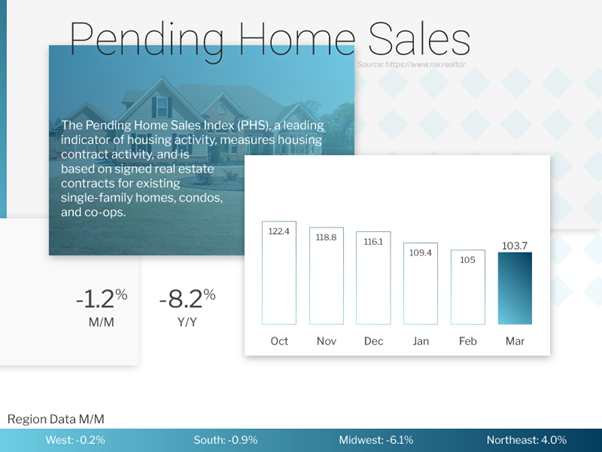
Pending Home Sales, which measure signed contracts on existing homes, fell 1.2% in March, though this was stronger than the 1.8% decline expected. Sales are now down 8.2% year over year. There is no doubt that higher interest rates could be impacting demand, but this report far from signals a “washout” spring homebuying season, as some in the media have said.
In fact, a longer timeframe view shows that the current level of signed contracts is still strong. The annual comparison is skewed because of the huge demand that followed the dip in signed contracts after the start of COVID.
What’s the bottom line? Although higher rates and low inventory around the country have made buying a home challenging for many people, renting is not necessarily a better option. CoreLogic’s Single-Family Rent Index showed that rents were up 13.1% year over year in February, which is the highest increase on record. This report includes both new rents and renewals, which are increasing between 6-8%. Apartment List’s National Rent Report, which measures new rents, also showed that rents increased by 0.9% in April and 16.3% year over year.
First Quarter GDP Turns Negative – Why This Matters
The first look at GDP for the first quarter showed that growth was down 1.4%. This is significant because an old textbook definition of a recession is two consecutive quarters of negative GDP. Note that we will get two more revisions to this figure before getting the final reading in June. In addition, a recession will not be confirmed until September, once the final readings for both the first and second quarters are reported.
Family Hack of the Week
May is National Strawberry Month. This Strawberry Rhubarb Crisp from our friends at the Food Network is perfect for kicking off the month in style.
Preheat oven to 350 degrees Fahrenheit. Cut 4 to 5 stalks of rhubarb into 1-inch dice until you have 4 cups’ worth. Hull and halve strawberries until you also have 4 cups’ worth. In a large bowl, toss rhubarb and strawberries with 1 1/4 cups granulated sugar and 1 1/2 teaspoons grated orange zest. Dissolve 1 tablespoon corn starch into 1/2 cup freshly squeezed orange juice and mix into fruit mixture. Pour the fruit into an 8-by-11-inch baking dish. Place on a sheet pan lined with parchment paper.
To make the topping, add 1 cup all-purpose flour, 1/2 cup sugar, 1/2 cup light brown sugar (lightly packed), 1/2 teaspoon Kosher salt, and 1 cup quick-cooking (not instant) oatmeal to the bowl of an electric mixer and mix to combine. With the mixer on low speed, add 1 1/2 sticks cold, unsalted butter and mix until dry ingredients are moist and mixture is in crumbles.
Sprinkle topping over the fruit and bake for 1 hour, until fruit is bubbling and topping is golden brown. Serve warm and enjoy topped with your favorite vanilla ice cream.
What to Look for This Week
Look for key reports from the labor sector, beginning Wednesday when the ADP Employment Report will give us an update on private payrolls for April. Thursday brings the latest Jobless Claims data while on Friday the Bureau of Labor Statistics Jobs Report for April will be released, which includes Non-farm Payrolls and the Unemployment Rate.
But perhaps the biggest news will be the Fed’s two-day meeting beginning Tuesday, with the Monetary Policy Statement and press conference coming on Wednesday. The Fed is expected to hike its benchmark Fed Funds Rate by 50 basis points and investors will be closely watching what actions they take to address inflation, and what their messaging is regarding their balance sheet.
Technical Picture
Mortgage Bonds have broken back beneath the falling trendline, which had been acting as a floor of support at the 101.656 level. Bonds are now trading in a range with 101.656 acting as resistance and support at 101.29. The 10-year is currently battling with a ceiling at the critical 2.92% level. If yields break above this level, it can have a negative impact on Mortgage Bonds.