
Week of April 18, 2022 in Review
Sales of existing homes fell 2.7% in March to a 5.77 million unit annualized pace. Note that this likely measured activity in January and February when rates were rising but not at the levels they are today. On a year over year basis, sales were only down 4.5%, which is still quite strong considering higher rates, higher home prices and tight inventory.
And speaking of inventory, there were 950,000 homes for sale at the end of March. While this is an increase of almost 12% from February, this level represents just a 2 months’ supply of homes available for sale, while a 6 months’ supply of homes reflects a balanced market.
Housing Starts, which measure the start of construction on homes, increased 0.3% in March to an annualized rate of 1.79 million units. However, starts for single-family homes, which are the most important because they are in such high demand among buyers, decreased by 1.7% monthly and 4.4% annually. Building Permits, which are a good forward-looking indicator for Housing Starts, declined for single-family homes as well, down 4.8% monthly and 3.9% year over year.
Builder confidence fell for the fourth straight month, as the National Association of Home Builders Housing Market Index declined 2 points to 77 in April. Looking at the components of the index, current sales conditions fell 2 points to 85, which is still very strong, while buyer traffic fell 6 points to 60. However, readings above 50 on this index, which runs from 0 to 100, still signals expansion. In other words, while some of these figures are contracting, they are still at strong levels overall.
Initial Jobless Claims declined by 2,000 in the latest week, with the number of people filing for unemployment benefits for the first time falling to 184,000. The number of people continuing to receive benefits fell by 58,000 to 1.417 million, which is the lowest number of Continuing Claims since 1970. There are now 1.622 million people in total receiving benefits, which is a stark contrast to the nearly 17.4 million people receiving benefits in the comparable week last year. The labor market remains tight as employers are holding on to their workers and firing less.
Wednesday’s 20-year Bond auction was met with strong demand. The bid to cover of 2.8 was higher than the one-year average of 2.4. Direct and indirect bidders took 91.2% of the auction compared to 81.0% in the previous 12. While Mortgage Bonds responded well to this news Wednesday, they gave back much of their gains Thursday morning.
Lastly, the World Bank slashed their global growth forecast from 4.1% to 3.2%. The largest single factor in the reduced growth forecast was a projected economic contraction of 4.1% across Europe and Central Asia. Other factors included higher food and fuel costs, and the Russia/Ukraine war. The International Monetary Fund (IMF) also said that they expect global economic growth to slow and feel the outlook has deteriorated. These are just additional indicators pointing to a global slowdown and increases the chances of a recession.
Existing Home Sales Decline for Second Consecutive Month
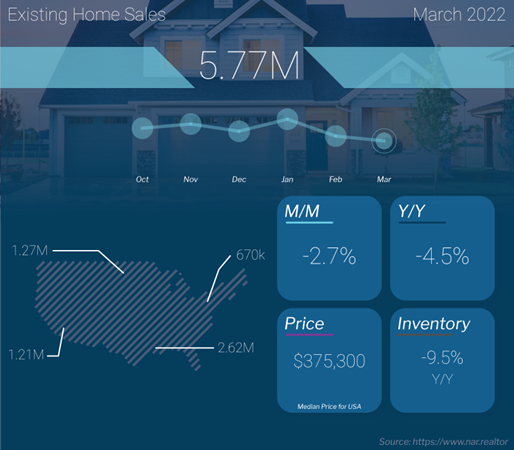
Existing Home Sales, which measure closings on existing homes, showed that sales were down 2.7% in March at a 5.77 million unit annualized pace. Note that this likely measured activity in January and February when rates were rising but not at the levels they are today. On a year over year basis, sales were only down 4.5%, which is still quite strong considering higher rates, higher home prices and tight inventory.
And speaking of inventory, there were 950,000 homes for sale at the end of March. While this is an increase of almost 12% from February, inventory is still 9.5% lower than it was in March of last year. There is now a 2 months’ supply of homes available for sale, which is up from 1.7 months at the end of February. However, a 6 months’ supply of homes reflects a balanced market.
Homes were only on the market for 17 days in March, down from 18 in February. In addition, 87% of homes that sold were on the market for less than one month. This should continue to be supportive of home prices.
The median home price was reported at $357,300, which is up 15% year over year. Remember that the median home price is not the same as appreciation. It simply means half the homes sold were above that price and half were below it. This figure continues to be skewed by the mix of sales, as sales on the lower end are down sharply, while sales above $500,000 are much higher.
First-time homebuyers accounted for 30% of sales, which is a nice move higher from 29% in the previous report and 27% two months ago. Cash buyers increased from 25% to 28%, while investors purchased 18% of homes, down from 19%. Foreclosures and short sales accounted for less than 1% of all transactions.
Single-family Starts and Permits Decline
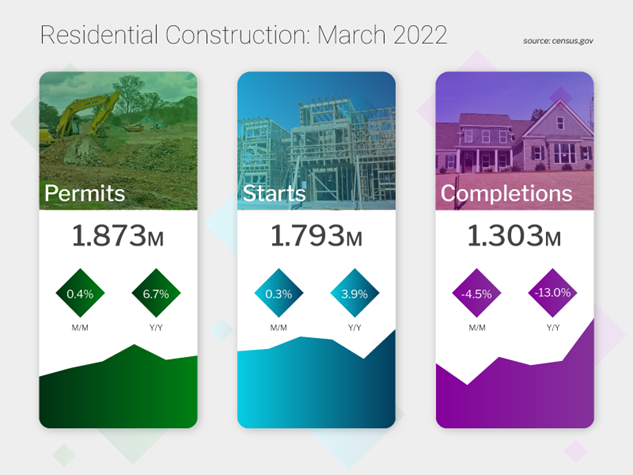
Housing Starts, which measure the start of construction on homes, increased 0.3% in March at an annualized rate of 1.79 million units. Year over year, Housing Starts were up 3.9%.
However, starts for single-family homes, which are the most important because they are in such high demand among buyers, decreased by 1.7% and they were down 4.4% from March of last year.
Building Permits, which are a good forward-looking indicator for Housing Starts, rose by 0.4% last month and they were up 6.7% on a year over year basis. Yet there were declines here as well for single-family permits, which fell 4.8% monthly and 3.9% year over year.
Speaking to the backlog of homes builders are contending with, single-family units authorized but not yet started were up almost 15% year over year, while single-family completions were down 6.4% monthly and 3.3% annually.
While the media often looks at these numbers and reports doom and gloom is ahead for housing, it’s important to remember that there are two sides to the coin. From an economic growth standpoint, tight inventory and fewer home sales are a negative, but when looking at housing as an investment, tight inventory is supportive of home prices.
Builder Confidence Declines But Remains in Expansion Territory
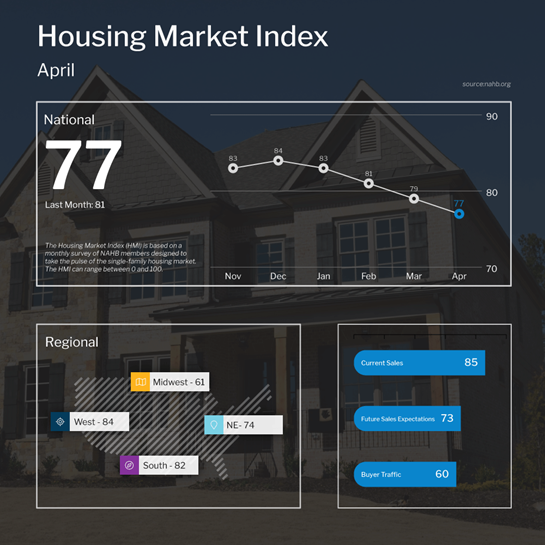
Builder confidence fell for the fourth straight month, as the National Association of Home Builders Housing Market Index declined 2 points to 77 in April.
Looking at the components of the index, current sales conditions fell 2 points to 85, which is still very strong, while buyer traffic fell 6 points to 60. Future sales expectations rose 3 points to 73, following the 10-point drop in March.
It should be noted, however, that a reading above 50 on this index, which runs from 0 to 100, still signals expansion. So, while some of these figures are contracting, they are still at strong levels overall.
Continuing Claims Reach Lowest Level Since 1970
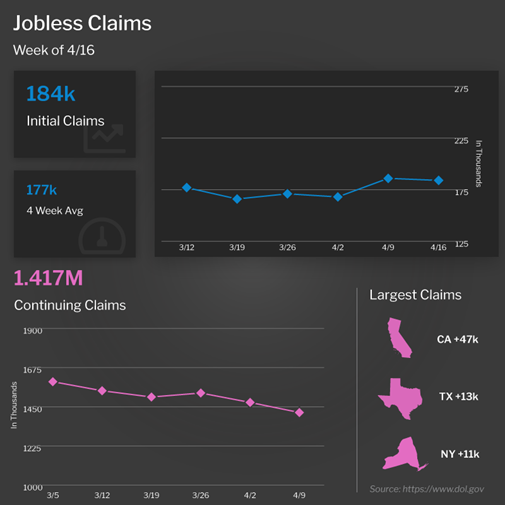
The number of people filing for unemployment benefits for the first time declined by 2,000 in the latest week, as 184,000 Initial Jobless Claims were filed.
Continuing Claims, which measure people who continue to receive benefits after their initial claim is filed, fell by 58,000 to 1.417 million. This is the lowest number of Continuing Claims since 1970.
There are now 1.622 million people in total receiving benefits, which is a decline of just over 88,000 from the previous week and even more importantly a stark contrast to the nearly 17.4 million people receiving benefits in the comparable week last year.
The story here remains the same: The labor market remains tight as employers are holding on to their workers and firing less.
Home Hack of the Week
Wish you had more garage storage space? These simple organizing tips from our friends at HGTV will help.
Prepare ahead of time by gathering trash bags, cleaning supplies, empty boxes for items to donate, and various sizes of plastic containers for storing items. Create zones in your driveway for items that can be thrown away, items that can be donated and items that need to be organized and returned to the garage. Once you’ve emptied your garage, sweep the floor and clean surface areas as needed.
Categorize items you’ll be keeping in your garage, such as sports equipment, seasonal décor, garden gear and automotive. Then set up zones within your garage so items in the same category are organized together. Pegboards and cabinets can help you take advantage of vertical space.
Consider creating cubbies for each family member, so they have a dedicated space for their sports equipment, toys, bikes and other items. Also, save a dedicated space for any seasonal items you may need to bring into the garage during cooler months.
What to Look for This Week
More housing news is ahead beginning Tuesday when home price appreciation figures for February will be released from the Case-Shiller Home Price Index and the Federal Housing Finance Agency (FHFA) House Price Index. March’s New Home Sales will also be reported on Tuesday while Pending Home Sales follow on Wednesday.
On Thursday, we’ll get the first estimate for GDP for the first quarter along with the latest Jobless Claims figures.
Ending the week, crucial inflation data for March will be reported on Friday via the Personal Consumption Expenditures index, along with Personal Income and Spending.
Technical Picture
After a very volatile session on Friday, Mortgage Bonds ended last week between support at the 0% Fibonacci level at 101.29 and resistance at 101.65. The 10-year is still battling with support at the critical 2.92% level but managed to close beneath it Friday. If the 10-year can stay beneath this floor, there is a lot of room for improvement before reaching the next level of support at 2.65%.