
Week of March 14, 2022 in Review
As expected, the Fed took action to address soaring inflation at its meeting last week by hiking their benchmark Fed Funds Rate. Note that the Fed Funds Rate is the interest rate for overnight borrowing for banks and it is not the same as mortgage rates. Investors were closely listening to Fed Chair Jerome Powell’s press conference following the meeting, for clues regarding additional actions the Fed may take this year that could impact mortgage rates and a key recession indicator. Don’t miss the important explanations below.
Speaking of inflation, it remains red hot at the wholesale level. The Producer Price Index rose 0.8% in February while on a year over year basis, the index was unchanged at a record high 10% after January’s report was revised higher. Core PPI, which strips out volatile food and energy prices, rose 0.2% in February, while the year over year figure declined from an upwardly revised 8.5% to 8.4%, which is just off another record.
In housing news, sales of existing homes declined in February to an annualized pace of 6.02 million units. Note that this likely measured activity in December and January, when rates were rising but not at the levels they are today. But the real story remains low inventory. There were only 870,000 homes for sale at the end of February, which is just above the record low of 860,000 homes in January.
Meanwhile, rental prices rose 12.6% on an annual basis in January, per CoreLogic’s Single-family Rent Report. This marked the tenth consecutive month of record high growth. This report measures both new and renewal rents for both single-family homes and condos, putting it slightly lower than recent data from Apartment List, which looks primarily at new rents.
Housing Starts, which measure the start of construction on homes, increased 6.8% in February to an annualized rate of 1.77 million. This was almost double expectations and the highest level in 16 years! Starts for single-family homes, which are the most important because they are in such high demand among buyers, also increased by 5.7% and they were up almost 14% year over year. With low inventory a pervasive problem around the country, this is a welcome sign and should help improve future inventory levels.
Builder confidence declined 2 points to 79 in March, per the National Association of Home Builders Housing Market Index. Looking at the components of the index, the real decline came in future sales expectations, which fell 10 points and is likely due to ongoing supply chain issues, labor costs, geopolitical uncertainty and higher rates. It should be noted, however, that a reading above 50 on this index, which runs from 0 to 100, still signals expansion.
Also of note, Initial and Continuing Jobless Claims both declined in the latest week. There are now 1.968 million people in total receiving benefits, which is a stark contrast to the 18.9 million people receiving benefits in the comparable week last year. Claims are at very strong pre-pandemic levels, showing that the labor market remains tight.
Lastly, Retail Sales rose 0.3% in February, which was just beneath expectations. However, there was a big revision to sales in January of just over 1% to the upside. When factoring that in, Retail Sales still remain strong. This data begs the question of when inflation may cause more of a reduction in spending, especially given that we may be heading into recession-like conditions.
Understanding the Fed Rate Hike
The Fed met last week and, as expected, hiked the Federal Funds Rate by 25 basis points. Note that the Fed Funds Rate is the interest rate for overnight borrowing for banks and it is not the same as mortgage rates.
Looking at their dot plot chart, the majority of Fed members are expecting seven additional hikes this year. There are six remaining Fed meetings this year, which implies that there would have to be a double or 50 basis point hike at one of the upcoming meetings.
In addition, the Fed increased their 2022 inflation expectations by 65% from 2.6% to 4.3%. They also revised GDP lower from 4% to 2.8%.
The big negative for Mortgage Bonds was the Fed’s comments on their $9 trillion balance sheet. The Fed said that they would start to reduce their balance sheet at “a coming meeting” and in the Q&A session, Fed Chair Jerome Powell said they may finalize their plan at their next meeting in May.
So, what does all of this potentially mean for mortgage rates?
Remember that the Fed has two levers they can pull for tightening the economy – hiking their benchmark Fed Funds Rate and reducing their balance sheet. Hiking the Fed Funds Rate will actually be a good thing for mortgage rates, as the Fed curbs inflation and preserves the fixed return a longer data Bond provides.
However, reducing their balance sheet (which means allowing Bonds to fall off their balance sheet and no longer reinvesting in them each month) would cause more supply on the market that has to be absorbed. This can cause mortgage rates to move higher.
The bottom line is that we will want to closely watch how the Fed tries to walk the tightrope of hiking and allowing a balance sheet runoff during 2022.
Watching an Important Recession Indicator
The yield spread between the 10-year Treasury and 2-year Treasury has been trending lower and when this goes inverted, it’s been a reliable recession indicator.
Normally, you would expect to receive a higher rate of return for putting your money away for 10 years versus 2 years. But when there is an economic slowdown and fear in the markets, the yield curve can go inverted – meaning that 2-year yields are higher than 10-year yields, which is backwards or upside down. Looking back at the history of recessions, we always see an inversion occur ahead of a recession, although it could take six months to two years for the actual recession to occur.
While we are not seeing the 10-year / 2-year spread go inverted yet, it has narrowed a great deal. And when the Fed hikes the Fed Funds Rate, this causes short-term yields to rise and can cause long-term yields to fall if it’s perceived that the rate hikes are getting inflation under control.
We are not seeing long-term yields fall yet, but short-term yields are climbing. And while there is not an inversion between the 10-year and 2-year, there are other inversions happening on the yield curve.
Recently, we’ve seen the 7-year yield move higher than the 10-year, the 5-year yield at about the same level as the 10-year, the 3-year yield 3 basis points beneath the 10 year, and the 20-year yield above the 30-year yield.
This is another important factor to closely watch in the months ahead.
Record High Wholesale Inflation
The Producer Price Index (PPI), which measures inflation on the wholesale level, rose 0.8% in February, which was just beneath estimates of 0.9%. On a year over year basis, PPI was unchanged at 10% after January’s report was revised higher. The index is at a record high since the methodology for collecting data was changed in 2010.
Core PPI, which strips out volatile food and energy prices, rose 0.2% in February, which was cooler than the 0.6% rise expected. The year over year figure declined from an upwardly revised 8.5% to 8.4%, which is just off another record.
Producer inflation remains elevated, which often leads to hotter consumer inflation levels, as producers pass those higher costs along to consumers. And keep in mind that this report was for February, before both the war in Ukraine and China’s shut down of the Shenzhen region due to a COVID outbreak. This area of China is known as its “Silicon Valley,” and the shutdown will likely cause more pressure on producer prices.
Existing Home Sales Drop in February
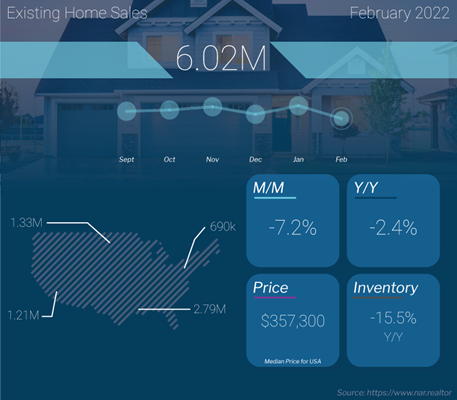
Existing Home Sales, which measure closings on existing homes, showed that sales were down 7.2% in February to an annualized pace of 6.02 million units. Note that this likely measured activity in December and January, when rates were rising but not at the levels they are today. While this data was a bit worse than expectations, it does follow a similar rise in the previous month. On a year over year basis, sales were only down 2.4%, which is quite miraculous considering higher rates, higher home prices and no inventory.
And speaking of inventory, there were only 870,000 homes for sale at the end of February. This is up a little over 2% from the record low in January but is still down 15.5% annually and at very depressed levels. From July, inventory is down about 33%.
There was only a 1.7 months’ supply of homes available for sale at the end of February. Six months is considered a more balanced market, so the current low inventory levels speak to the imbalance of supply and demand. Homes were only on the market for 18 days in February, down from 19 in January. This should continue to be supportive of home prices.
The median home price was reported at $357,300, which is up 15% year over year. Remember that the median home price is not the same as appreciation. It simply means half the homes sold were above that price and half were below it. This figure continues to be skewed by the mix of sales, as sales on the lower end are down sharply, while sales above $500,000 are much higher.
First-time homebuyers accounted for 29% of sales, which is up slightly from 27% in January. Cash buyers declined from 27% to 25%, while investors purchased 19% of homes, down from 22%. Foreclosures and short sales accounted for less than 1% of all transactions.
Rents on the Rise
CoreLogic’s Single-family Rent Report showed that rent prices hit a tenth consecutive month of record high growth in January. Year over year, rents increased 12.6%, up from the 12% annual growth reported in December. By comparison, rents were up just 3.9% annually in January 2021.
Miami led the way with rental prices up 38.6%, followed by Orlando at 19.9%. Washington, D.C. had the lowest increase at 5.6%.
Note that this report measures both new and renewal rents for both single-family homes and condos, putting it lower than recent data from Apartment List. Their rent report, which looks primarily at new rents, showed nearly 18% annual growth in February. To put this in context, annual rent growth averaged just 2.3% in the pre-pandemic years from 2017-2019.
Housing Starts Nearly Double Expectations
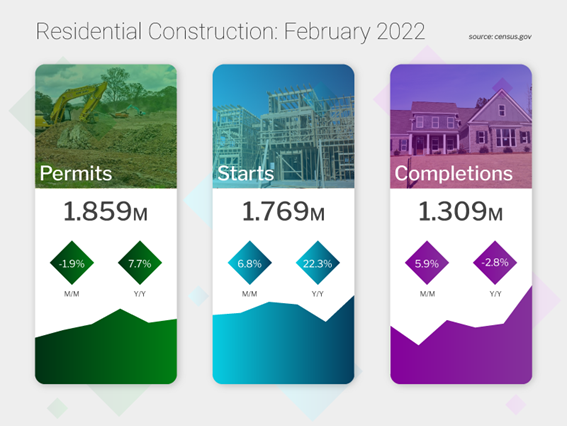
Housing Starts, which measure the start of construction on homes, increased 6.8% in February to an annualized rate of 1.77 million. This was almost double expectations and the highest level in 16 years! Year over year, Housing Starts were up 22%.
Starts for single-family homes, which are the most important because they are in such high demand among buyers also increased by 5.7% and they were up almost 14% year over year.
Building Permits, which are a good forward-looking indicator for Housing Starts, fell by 1.9% last month, but they were up 7.7% on a year over year basis. Single-family Permits also fell 0.5%, but they were up 5.4% year over year.
The bottom line is that low inventory has been a big issue around the country, so the increase in Housing Starts is a welcome sign and should help future inventory levels.
Builder Confidence Declines for Fourth Straight Month
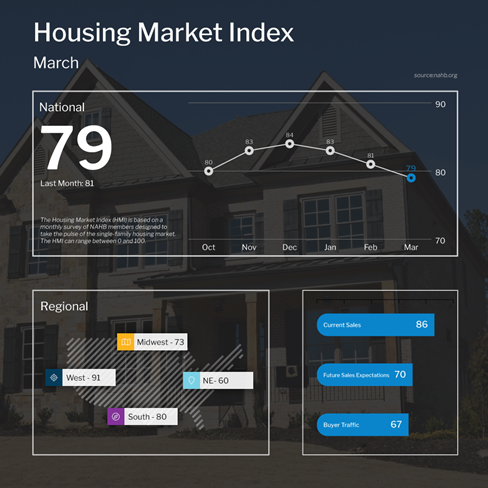
The National Association of Home Builders Housing Market Index, which is a real-time read on builder confidence, fell 2 points to 79 in March from a downwardly revised reading of 81 in February.
Looking at the components of the index, current sales conditions fell 3 points to 86, which is still very strong. Buyer traffic increased 2 points to 67, which is also showing strength. The real decline came in future sales expectations, which fell 10 points. This is likely due to ongoing supply chain issues, labor costs, geopolitical uncertainty and higher rates.
It should be noted, however, that a reading above 50 on this index, which runs from 0 to 100, still signals expansion.
While NAHB’s Index showed a decline in builder confidence, Lennar, who is the largest homebuilder in the U.S., reported that they are still seeing very strong demand on all their sites and expect sales to increase this year.
Initial and Continuing Jobless Claims Decline
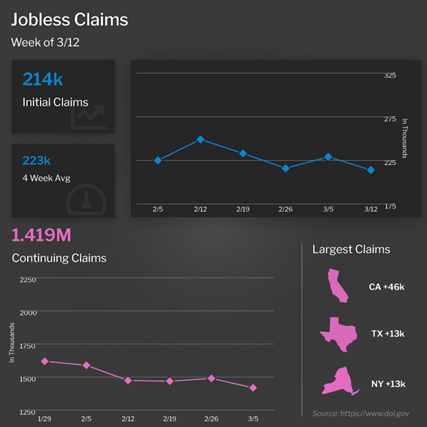
The number of people filing for unemployment benefits for the first time declined by 15,000 in the latest week, as Initial Jobless Claims were reported at 214,000.
Continuing Claims, which measure people who continue to receive benefits after their initial claim is filed, also fell by 71,000 to 1.419 million.
There are now 1.968 million people in total receiving benefits, and while this is almost 60,000 more than the prior week, more importantly it is a stark contrast to the 18.9 million people receiving benefits in the comparable week last year. Claims are at very strong pre-pandemic levels, showing that the labor market remains tight.
Family Hack of the Week
This Wednesday, March 23 is National Chip and Dip Day. Whether you’re planning a March Madness gathering or a game or movie night, you’ll be sure to impress friends and family alike with this Spinach and Artichoke Dip recipe courtesy of our friends at Delish.
Preheat oven to 350 degrees Fahrenheit. Drain and chop 1 14-ounce can of artichoke hearts. Defrost and chop one 10-ounce package of frozen spinach.
In a large bowl, combine artichoke hearts and spinach with 1 8-ounce block softened cream cheese, 3/4 cup mayonnaise, 3/4 cup sour cream, 1 cup freshly grated Parmesan, 1 cup shredded white cheddar, 1/2 cup shredded Gruyere, 2 cloves garlic (minced), 1 teaspoon lemon zest and 1/2 teaspoon red pepper flakes.
Mix until fully combined and season with Kosher salt and black pepper to taste. Top with more shredded white cheddar.
Bake until bubbly and slightly golden, approximately 30 minutes. Broil on high an additional 2 minutes if you prefer a more golden top.
Enjoy with your favorite chips for dipping.
What to Look for This Week
After last week’s full economic calendar, this week’s release schedule is quieter but features several key reports to note.
More housing news is ahead when New Home Sales for February are reported on Wednesday. February’s Pending Home Sales follow on Friday.
The latest Jobless Claims data will be reported on Thursday, as usual, along with February’s Durable Goods Orders. Investors will also be closely watching Wednesday’s 20-year Bond auction for the level of demand.
Technical Picture
Mortgage Bonds ended last week higher than they were when the Fed hiked after testing support at 100.446 and bouncing higher in the latter half of the week. This is a bottoming out structure, coupled with a positive stochastic crossover. Bonds have been oversold for a long time and appear to be due for a rebound. The 10-year is in a similar position, now back under 2.16%.