
Week of April 11, 2022 in Review
The Consumer Price Index (CPI) showed that consumer inflation increased by 1.2% in March while the year over year reading rose from 7.9% to 8.5%, which is the hottest reading in 41 years! Core CPI, which strips out volatile food and energy prices, rose by 0.3%. On an annual basis, Core CPI increased from 6.4% to 6.5%, which was a bit less than anticipated. While the headline inflation jump was expected due to rising oil and food prices, the Core reading was cooler than anticipated and garnered a positive reaction in the Bond market when the data was released last Tuesday.
Wholesale inflation also remains red hot, as the Producer Price Index (PPI) rose 1.4% in March. On a year over year basis, PPI rose from 10.3% to 11.2%, which is the highest level on record since the methodology for collecting data was changed in 2010.
Core PPI, which also strips out food and energy prices, doubled expectations with a 1% increase in March. The year over year figure increased from 8.7% to 9.2%. Elevated producer inflation can lead to hotter consumer inflation levels, as producers can pass those higher costs along to consumers.
Despite the rise in inflation, consumers continued to spend in March as Retail Sales rose 0.5%, just below the 0.6% expected gain. Sales in January were also revised higher from a 0.3% monthly rise to 0.8%.
Small business owners also reported that inflation was the biggest problem in March, per the National Federation of Independent Business Small Business Optimism Index. Within the report, companies that expect higher selling prices rose another 4 points to 72%, which is the highest on record dating back to 1980. In addition, 50% of companies reported plans to raise prices going forward.
Over in the labor sector, the number of people filing for benefits for the first time increased by 18,000 in the latest week, as there were 185,000 Initial Jobless Claims. However, this is coming off a near 54-year low in the previous week, so a bounce higher is understandable. There are now 1.703 million people in total receiving benefits, which is a stark contrast to the 17 million people receiving benefits in the comparable week last year. The labor market remains tight as employers are holding on to their workers and firing less.
Meanwhile, the Cass Freight Index, which is a monthly measure of the North American freight market, showed that freight volumes slowed from 3.6% year over year in February to 0.6% in March. Shipments were up almost 3%, but Cass Freight said this is 100 basis points below the normal seasonal pattern. All goods in the U.S. travel along some type of freight so it will be important to see if this slowdown is an early sign of a potential turning point, as this report has been another early recession indicator in the past.
Lastly, investors were closely watching Tuesday’s 10-year Treasury Note auction and Wednesday’s 30-year Bond auction to see the level of demand. Find out the results below.
Consumer Inflation Hits Highest Level Since 1981
Core (CPI), which strips out volatile food and energy prices, rose by 0.3%. As a result, year over year Core CPI increased from 6.4% to 6.5%, which was a bit less than anticipated. The headline inflation jump was expected due to rising oil and food prices, but the Core reading was cooler than anticipated and garnered a positive reaction in the Bond market when the data was released last Tuesday.
Within the report, rents rose 0.4% in March and increased from 4.2% to 4.4% on a year over year basis. While this data has started to increase, the CPI report is still not capturing the double digit increases year over year that many other rent reports are showing.
Owners’ equivalent rent also increased 0.4% and the year over year figure rose from 4.3% to 4.5%. However, note that this data is based on a survey that asks homeowners, “If someone were to rent your home today, how much do you think it would rent for monthly, unfurnished and without utilities?” Understandably, this is very subjective and many people would be guessing these amounts so while this data tries to capture the rise in home prices, it does a poor job.
Some other notable price increases since last year include food (+9%), gasoline (+48%) and used cars (+35%).
Why is rising inflation significant?
Wholesale Inflation Hits New Record High
The Producer Price Index, which measures inflation on the wholesale level, rose 1.4% in March, which was hotter than expectations of 1.1%. On a year over year basis, PPI rose from 10.3% to 11.2%, which is the highest level on record since the methodology for collecting data was changed in 2010.
Core PPI, which also strips out food and energy prices, doubled expectations with a 1% increase in March. The year over year figure increased from 8.7% to 9.2%.
Producer inflation remains elevated, which often leads to hotter consumer inflation levels, as producers pass those higher costs along to consumers. And as noted below, about 50% of the companies surveyed by the NFIB expect future price hikes.
Small Business Owners Report Inflation Is Their Biggest Challenge
March’s National Federation of Independent Business Small Business Optimism Index showed that small businesses grew less optimistic last month, as the index fell to the weakest level in two years.
Small business owners reported that inflation is the biggest problem right now, followed by ongoing staffing shortages and supply chain disruptions. As a result, companies that expect higher selling prices rose another 4 points to 72%, which is the highest in the survey’s history. In addition, 50% of owners reported plans to raise prices going forward.
In addition, owners expecting better business conditions over the next six months fell 14 points to a -49%, which is the lowest level since the beginning of the survey in 1973. Given that we have experienced several recessions, a housing bubble and the COVID pandemic over the last 50 years, the fact that owners are feeling so negative right now could be yet another indicator that we may be headed for a recession.
Jobless Claims Show Labor Market Remains Tight
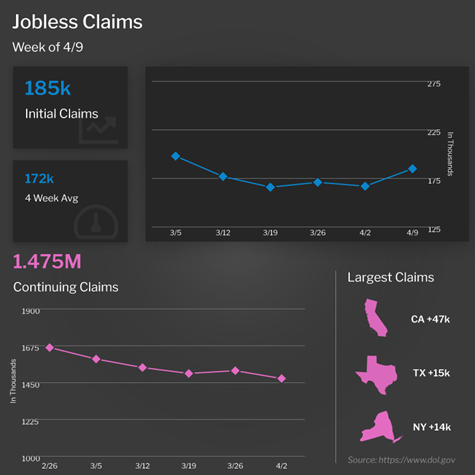
Initial Jobless Claims ticked higher in the latest week, as the number of people filing for benefits for the first time increased by 18,000 to 185,000. However, this is coming off a near 54-year low in the previous week, so a bounce higher is understandable.
Continuing Claims, which measure people who continue to receive benefits after their initial claim is filed, fell by 48,000 to 1.475 million.
There are now 1.703 million people in total receiving benefits, which is a decline of nearly 20,000 from the previous week and even more importantly a stark contrast to the 17 million people receiving benefits in the comparable week last year.
The story here remains the same: The labor market remains tight as employers are holding on to their workers and firing less.
The Scoop on Key Auctions
Investors were closely watching Tuesday’s 10-year Treasury Note auction and Wednesday’s 30-year Bond auction to see the level of demand. High demand, which is reflected in the purchasing of Bonds and Treasuries, can push prices higher and yields or rates lower.
Weak demand, on the other hand, can signal that investors think yields will continue to move higher, which can have a negative effect on rates.
Tuesday’s 10-year Note auction was met with below average demand. The bid to cover of 2.43 was below the one-year average of 2.50. Direct and indirect bidders took 81.3% of the auction compared to 85.2% in the previous 12. After the weak auction, yields gave back some of their move lower, but still ended the day lower.
Wednesday’s 30-year Bond auction was met with average demand. The bid to cover of 2.30 was just under the one-year average of 2.31. Direct and indirect bidders took 84.1% compared to 82.4% in the previous 12.
Family Hack of the Week
This Saturday, April 23 is National Picnic Day. You’ll plan the perfect day out with friends and family thanks to these simple tips from our friends at Taste of Home.
When packing your cooler, keep the ratio around 75% food and 25% ice. Place ice on the bottom and along the sides of the cooler, then add the heaviest and most perishable items on top of the ice. A fuller cooler will stay colder longer and larger pieces of ice will melt more slowly than ice cubes. Fill plastic bags with water and freeze the night before, then use them as needed to fill your cooler.
Place things like napkins, cutlery, hand sanitizer and bug spray in sealable plastic bags and tape them to the inside top of your cooler. Not only will this consolidate the number of items you have to carry to your picnic spot, it will also save you an unexpected trip back to the car if they accidentally get left behind. Individual packets of mustard, ketchup, mayonnaise, salt and pepper are also perfect to include with the cutlery so you don’t run the risk of larger jars spoiling from being left out in the sun.
Keep your menu concise and simple by planning things that aren’t too heavy to carry, especially if your perfect picnic spot involves a hike or long walk to get there. Also, plan out portions so you won’t have a lot left to carry back with you. And don’t forget the trash bags in case there aren’t waste bins nearby.
What to Look for This Week
Housing news dominates this week’s economic calendar, beginning Monday with the National Association of Home Builders Housing Market Index for April, which will give us a near real-time read on builder confidence.
On Tuesday, we’ll get a look at March’s Housing Starts and Building Permits, while Wednesday brings March’s Existing Home Sales.
On Thursday, the latest Jobless Claims data will be reported as usual.
Technical Picture
Mortgage Bonds moved sharply lower on Thursday and ended last week sitting on an important floor at 100.00. The 10-year broke above resistance at 2.766% and ended last week trading at around 2.82%, which is the highest level since 2018. The markets were closed Friday in observance of Good Friday.