
Week of August 1, 2022 in Review
July Jobs Report a Big Surprise
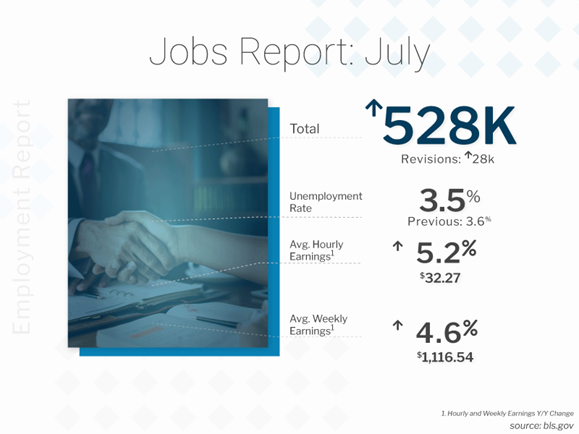
The Bureau of Labor Statistics (BLS) reported that there were 528,000 jobs created in July, which was more than double expectations of 250,000 new jobs. In addition, there were positive revisions to the data for May and June adding 28,000 jobs in those months combined. The Unemployment Rate declined from 3.6% to 3.5%.
Note that the headline unemployment rate removes people who are not actively searching for a job and there were almost 6 million people that are not being counted who “want a job” but have not looked in the last four weeks. The U-6 all-in unemployment rate, which adds back all these individuals and is more indicative of the true unemployment rate, remained at 6.7%.
What’s the bottom line? While the headline figures looked strong, there is more to the story.
There are two reports within the Jobs Report and there is a fundamental difference between them. The Business Survey is where the headline job number comes from and it’s based predominately on modeling. The Household Survey, where the Unemployment Rate comes from, is done by actual phone calls to 60,000 homes. The Household Survey also has a job loss or creation component, and it showed there were 179,000 job creations, which is a pretty big disparity from the headline number of 528,000 jobs. The Household Survey also showed that the labor force decreased by 63,000.
The increase in jobs combined with the decline in GDP that we have seen speaks to a lack of productivity, where more employees are being hired but less goods are being produced. This can add to the inflation pressures we are already experiencing.
The Fed’s Take on the Labor Market, Inflation and Recession
Last week, several Fed members reiterated their commitment to fight inflation, with the common theme being they don’t think the US is currently in a recession because of the strong labor market – and this was before July’s Jobs Report was released on Friday!
The Fed has been hiking its benchmark Fed Funds Rate, which is the interest rate for overnight borrowing for banks and it is not the same as mortgage rates, to help cool inflation. The strong headline jobs data for July should give the Fed cover to again hike its benchmark Fed Funds Rate at its meeting in September, which would follow the 25, 50, 75 and 75 basis points hikes they already made in March, May, June and July of this year.
Initial Jobless Claims Continue to Creep Higher
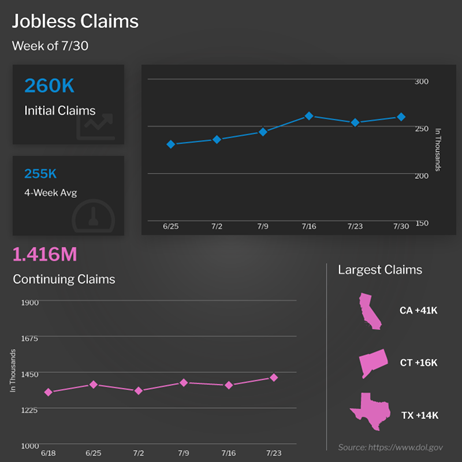
The number of people filing for unemployment benefits for the first time rose by 6,000 in the latest week, as 260,000 Initial Jobless Claims were reported. While we have not seen major increases in Initial Claims each week, they have been consistently moving higher. Continuing Claims, which measure people who continue to receive benefits after their initial claim is filed, rose 48,000 to 1.416 million. This is the highest level of Continuing Claims since the beginning of April.
What’s the bottom line? The 4-week average of Initial Jobless Claims moved up once again to its highest level since November. The trajectory higher is likely to continue, given the announcements of significant layoffs from several public companies, which means we will eventually see a higher unemployment rate. This report can be the “canary in the coal mine” to show that the job market is starting to soften.
In addition, the Job Openings and Labor Turnover (JOLTS) report showed that job openings fell 600,000 from 11.3 million to 10.7 million in June, which is the first time there has been less than 11 million job openings since last November. Job openings also declined nearly 1.2 million from the end of March to the end of June. The number of hirings fell for a fourth straight month and the hiring rate declined to 4.2%.
Home Prices Still Forecast to Appreciate at Meaningful Level
CoreLogic released their Home Price Index report for June, showing that home prices rose by 0.6% from May and 18.3% on a year over year basis. This annual reading declined from 20.2% in May but is still robust. CoreLogic forecasts that home prices will appreciate 0.6% in July and 4.3% in the year going forward.
What’s the bottom line? Remember that 4% appreciation can still be meaningful for wealth creation. For example, if someone bought a $400,000 home and put 10% down, that means they would gain $16,000 in appreciation over the next year and earn a 40% return on their investment due to leverage.
Family Hack of the Week
August 10 marks National S’mores Day. For a creative take on this popular campfire treat, try this delicious S’mores Pie courtesy of the Food Network.
Combine 14 ounces of milk chocolate chips and 3/4 cup heavy cream in a large microwave bowl and heat for 2 1/2 minutes. Stir until completely smooth and then pour into one 9-inch prepared graham cracker crust. Cover loosely with plastic wrap and refrigerate until set, approximately four hours.
Preheat broiler. Cut 15 marshmallows in half lengthwise from one corner to the opposite corner using kitchen shears. Arrange marshmallow halves cut side down on top of chilled pie. Watching closely, broil until golden brown, approximately one minute.
Let the pie cool, then cover loosely with plastic wrap and refrigerate until the ganache sets again, approximately 1 to 2 hours.
What to Look for This Week
Inflation data will be the big headliner, as July’s Consumer Price Index and Producer Price Index (which measures wholesale inflation) will be reported on Wednesday and Thursday, respectively.
Also of note, we’ll get a read on how small businesses were feeling last month when the National Federation of Independent Business Small Business Optimism Index is reported on Tuesday. The latest Jobless Claims data remains crucial to monitor when it is released as usual on Thursday.
Investors will also be closely watching Wednesday’s 10-year Note and Thursday’s 30-year Bond auctions for the level of demand.
Technical Picture
Mortgage Bonds moved sharply lower last Friday following the stronger than anticipated Jobs Report. They tested a quadruple floor of support formed by the 25-day Moving Average, 50-day Moving Average, Fibonacci level and rising trend line and were able to bounce higher. The 10-year moved up to 2.83% and ended last week battling with its 100-day Moving Average.