
Week of August 15, 2022 in Review
- What the Slowdown in Existing Home Sales Means for Home Prices
- Confidence Among Home Builders Falls Below Key Threshold
- Key Takeaway From the Slowdown in Home Construction
- The Significance of Jobless Claims Data
- Fed Minutes Show Acknowledgment of Slowdown
What the Slowdown in Existing Home Sales Means for Home Prices
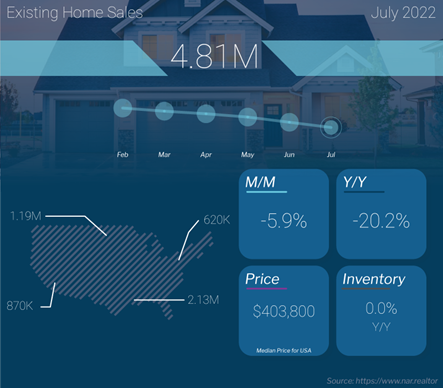
Existing Home Sales fell 5.9% from June to July to a 4.81 million unit annualized pace, per the National Association of Realtors (NAR). Sales were also down 20.2% when compared to July of last year. This is a critical report for taking the pulse of the housing market, as it measures closings on existing homes, which represent around 90% of the market. June’s report likely reflects people shopping for homes in May and June, which included the peak in rates that we saw in June.
What’s the bottom line? The annual decline in sales has led many, including NAR’s chief economist Lawrence Yun, to say that we are in a “housing recession.” However, there is a big difference between a housing activity recession, which we are clearly in, and a home price recession.
Activity has no doubt slowed, but home prices are still being supported by low inventory. There were 1.31 million homes available for sale at the end of July and this equates to a 3.3 months’ supply of homes. However, six months is considered a balanced market, so this data speaks to the ongoing imbalance of supply and demand, which should continue to be supportive of home prices. In addition, there were only 748,000 “active listings” in July, which means that 43% of the “inventory” in the Existing Home Sales report is under contract and not truly available. This speaks to demand, as a normal market has 25% of inventory under contract.
There were also signs that demand is still strong if homes are priced correctly. Average days on market remained at a blistering 14 days, which is the fewest since NAR began tracking this data in 2011.
Lastly, CoreLogic’s Single-family Rent Report showed that single-family rent prices remained elevated in June, up 13.4% from a year earlier. This is near the record high 13.9% annual gain reported in May. These increases in rental prices should continue to push people to see the opportunity in housing, which again will help homes continue to appreciate.
Confidence Among Home Builders Falls Below Key Threshold
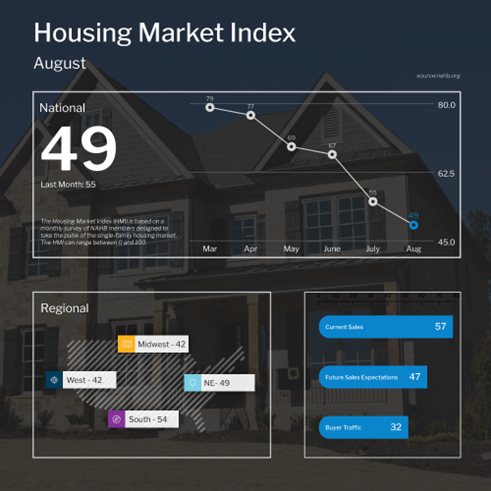
The National Association of Home Builders (NAHB) Housing Market Index, which is a near real-time read on builder confidence, fell 6 points to 49 in August, marking the eighth straight monthly decline. Looking at the components of the index, current sales conditions fell seven points to 57, sales expectations for the next six months were down two points to 47 and buyer traffic declined 5 points to 32.
What’s the bottom line? Any reading above 50 on this index, which runs from 0 to 100, signals expansion while readings below 50 signal contraction. This is the first time the index has dropped below 50 since May 2020. The decline in all of these readings shows that builders are anticipating a further slowdown.
NAHB’s chairman, Jerry Konter, said, “Ongoing growth in construction costs and high mortgage rates continue to weaken market sentiment for single-family home builders.”
Key Takeaway From the Slowdown in Home Construction
July saw a slowdown in home construction as Housing Starts, which measure the start of construction on homes, plunged nearly 10% from June. This was well below the expected 2.5% decline. More importantly, starts for single-family homes were also down 10.1% from June and 18.5% when compared to July of last year, adding to the disappointment because they are in such high demand among buyers.
Building Permits, which are a good forward-looking indicator for Housing Starts, declined 1.3% from June to July. Once again, single-family permits declined more significantly, dropping by 4.3% from June and nearly 12% year over year.
Housing units authorized but not yet started were up 5% last month and 18.4% when compared to July of last year, which speaks to the backlog in building. Meanwhile, Housing Completions were up just 1.1% from June to a 1.424 million unit annualized pace. With household formations around 1.7 million annualized, completions are not keeping pace.
What’s the bottom line? While interest rates are higher and demand is lower, supply remains tight. While the slowing new construction and low supply may hurt economic activity, from a home price standpoint it will be somewhat supportive. This is very different from the housing bubble, where demand was waning but supply of new homes was significantly increasing.
The Significance of Jobless Claims Data
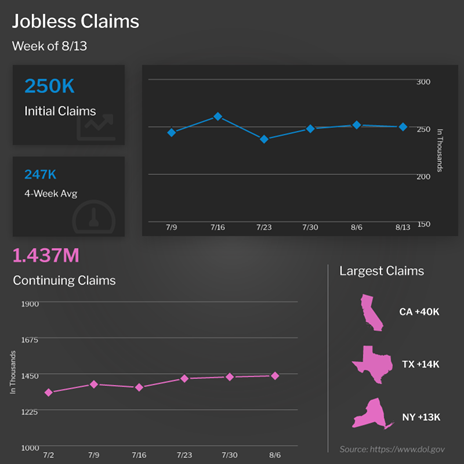
Initial Jobless Claims fell by 2,000 in the latest week, as 250,000 people filed for unemployment benefits for the first time. This marks the second week in a row that the number of first-time filers has been at or above 250,000. Continuing Claims, which measure people who continue to receive benefits after their initial claim is filed, rose 7,000 to 1.437 million, reaching a high not seen since the beginning of April.
What’s the bottom line? This report can be the “canary in the coal mine” to show that the job market is starting to soften. Given the announcements of significant layoffs from several public companies, it remains crucial to monitor the number of claims that are filed in the weeks ahead.
Fed Minutes Show Acknowledgment of Slowdown
The minutes from the Fed’s July 26-27 meeting showed that Fed members acknowledged a slowdown in housing, business investment, manufacturing and spending. Many participants also noted tentative signs of a softening outlook for the labor market. The Fed also made it pretty clear that they are going to be hiking their benchmark Fed Funds Rate at their meeting in September, likely by 50 basis points, as inflation is unacceptably high. This would follow the 25, 50, 75 and 75 basis point hikes they already made at their March, May, June and July meetings, respectively.
What’s the bottom line? The Fed Funds Rate is the interest rate for overnight borrowing for banks and it is not the same as mortgage rates. The main tool the Fed uses to curb inflation is hiking its benchmark Fed Funds Rate, so counterintuitively Fed rate hikes can be good for mortgage rates if they’re perceived to curb inflation.
Following September, the Fed will likely base future rate hikes on data, as they mentioned that at some point it would be appropriate to “slow the pace of policy rate increases while assessing the effects of cumulative policy adjustments on economic activity and inflation.”
Family Hack of the Week
Wednesday, August 24 is National Peach Pie Day. This “Perfect Peach Pie” recipe courtesy of the New York Times is a perfectly delicious way to celebrate.
Using the pulse function of a food processor, blend 2 1/2 cups all-purpose flour, 12 tablespoons cold, unsalted butter (cut into 1/2-inch cubes) and 1 teaspoon Kosher salt until the mixture resembles a coarse meal with pebbles of butter throughout. Add 1 egg yolk and 1 teaspoon cider vinegar to 1/4 cup ice water, stir and drizzle 4 tablespoons over the dough. If the dough does not hold together, add a little more liquid until it does.
Turn dough onto a lightly floured surface and gather into a rough ball. Divide until you have eight portions and use the heel of your hand to flatten each portion so the pebbles of butter expand. Gather the dough again into a ball, divide in half and flatten each ball into a 6-inch disc, with one slightly larger than the other. Wrap in plastic wrap and refrigerate for at least 1 hour.
Preheat oven to 425 degrees Fahrenheit. To make the filling, peel and slice 6 to 7 ripe peaches and combine with 2 tablespoons lemon juice, 1 cup granulated sugar and 1/4 cup all-purpose flour.
Remove larger dough from refrigerator, roll it out on a lightly floured surface and place in a 9-inch pie pan. Add peaches and sprinkle with ground nutmeg. Roll out second pastry disc and place on top of filling. Wet the edges of the bottom pastry with cold water, trim pastry, and pinch bottom and top edges together. Cut slits in the pastry to allow steam to escape, brush egg white on the top and edges, and sprinkle with pinch of granulated sugar.
Bake for 15 minutes and then reduce heat to 375 degrees Fahrenheit. Continue baking until peaches bubble and pastry is golden, approximately an additional 45 minutes to 1 hour.
What to Look for This Week
Housing news will continue to make headlines when July’s New and Pending Home Sales are reported on Tuesday and Wednesday, respectively.
Jobless Claims will be released on Thursday along with the second reading on second quarter GDP. Investors will be closely watching this GDP number, given that the first reading for second quarter was negative, which also followed the negative final reading for the first quarter.
Ending the week, crucial inflation numbers for July will be reported Friday via the Fed’s favored measure, Personal Consumption Expenditures.
Technical Picture
Mortgage Bonds battled their 50-day Moving Average but closed beneath it Friday. There is a lot of room to the downside until the next level of support at 99.281. The 10-year is also contending with its 50-day Moving Average, which is keeping a lid on yields for now.