
Week of November 27, 2023 in Review
There was welcome news for consumers as inflation continued to inch lower in October. Plus, tight housing inventory is still hindering contract signings and boosting home values. Here are last week’s headlines:
Inflation Inching Lower
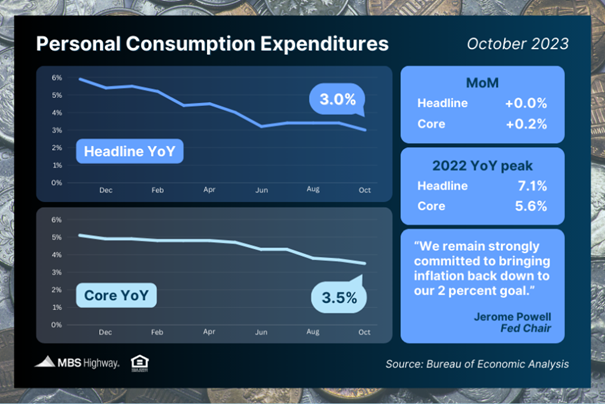
October’s Personal Consumption Expenditures (PCE) showed that headline inflation was flat for the month, with the year-over-year reading falling from 3.4% to 3%. Core PCE, the Fed’s preferred method which strips out volatile food and energy prices, rose by 0.2% in October. The year-over-year reading fell from 3.7% to 3.5% – the lowest level in more than two years.
What’s the bottom line? Inflation has made significant progress lower after peaking last year, with the headline reading at 3% (down from 7.1%) and the core reading at 3.5% (down from 5.6%). Plus, annualizing the last six months’ worth of readings puts Core PCE at 2.4%, which is even closer to the Fed’s 2% target.
Remember, the Fed has been hiking its benchmark Fed Funds Rate (which is the overnight borrowing rate for banks) to try to slow the economy and curb inflation.
Their latest hike in July was the eleventh since March of last year, pushing the Fed Funds Rate to the highest level in 22 years. The Fed did not hike at their September or November meetings, so they could continue to assess incoming inflation, labor sector and other economic data.
Many economists believe this progress lower is enough for the Fed to pause rate hikes once again at their next meeting. We’ll find out for sure on Wednesday, December 13.
Pending Home Sales Plunge in October
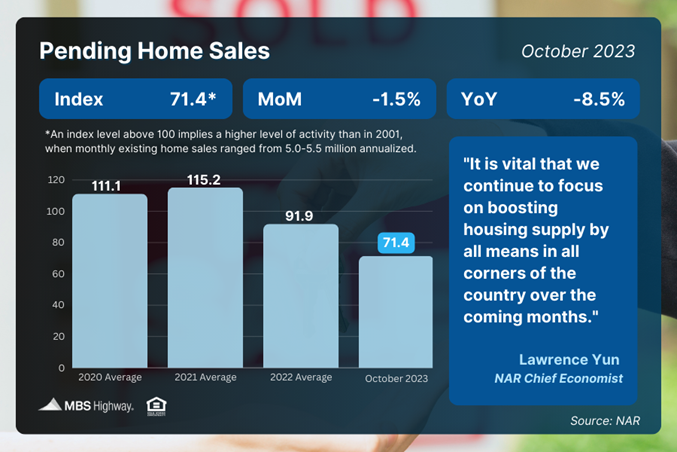
Pending Home Sales fell 1.5% from September to October, reaching the lowest level since the National Association of REALTORS® began tracking them in 2001. This data measures signed contracts on existing homes, making it a forward-looking indicator for closings as measured by Existing Home Sales.
What’s the bottom line? Elevated mortgage rates certainly caused many buyers to press pause on the home search this fall, but tight inventory remains a key challenge as well. NAR’s Chief Economist, Lawrence Yun, noted that “limited housing inventory is significantly preventing housing demand from fully being satisfied.” He added, “It is vital that we continue to focus on boosting housing supply by all means in all corners of the country over the coming months.”
What the Media Misunderstands About New Home Sales
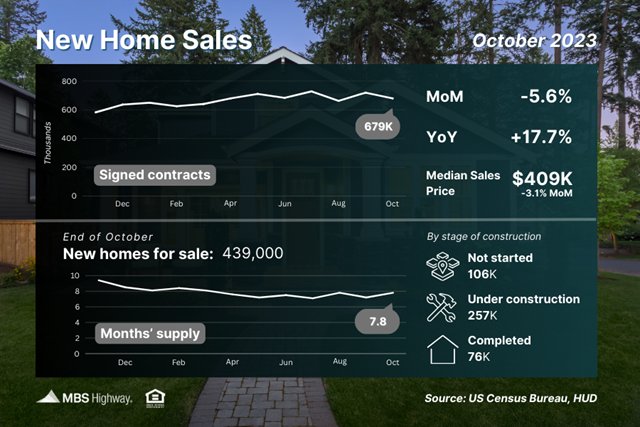
New Home Sales, which measure signed contracts on new homes, fell 5.6% from September to October to a 679,000-unit annualized pace. While elevated mortgage rates impacted activity last month, October’s signed contracts are still respectable numbers, as they were 15,000 higher than they were in August and 102,000 higher than in October of last year.
What’s the bottom line? There were 439,000 new homes available for sale at the end of October. While this is a slight uptick from September, more “available” supply is still needed to meet demand as only 76,000 of these homes were actually completed, with the rest either under construction or not even started yet.
In addition, the median sales price for new homes was $409,300, which was down on both a monthly and yearly basis. While some media reports suggested this means home prices are declining, that’s actually not the case.
The median home price represents the mid-price and can be skewed by the mix of sales among lower-priced and higher-priced homes. With builders creating more lower-priced, starter homes to meet demand, NAHB Chief Economist Robert Dietz explained that “median new home prices have moved lower as new home size has decreased in 2023.”
The top five appreciation indexes in the country actually show that home prices nationwide continue to hit record highs, as detailed below.
Home Values Still Standing Strong
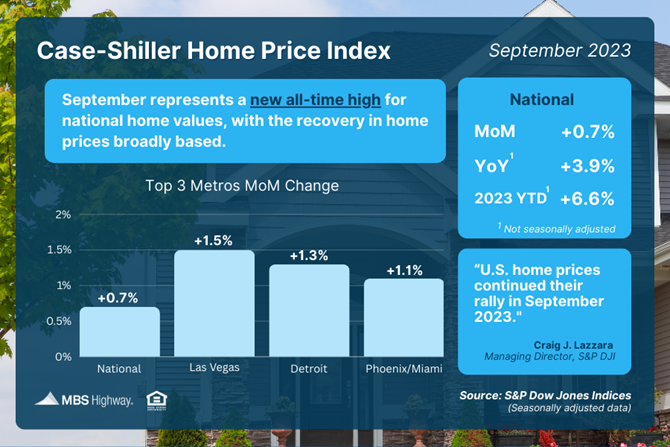
The Case-Shiller Home Price Index, which is considered the “gold standard” for appreciation, showed home prices nationwide rose 0.7% from August to September after seasonal adjustment, marking the eighth consecutive month of gains. The Federal Housing Finance Agency’s (FHFA) House Price Index also saw home prices rise 0.6% in September, with their index setting new record highs in home prices every month since February.
Note that FHFA’s report measures home price appreciation on single-family homes with conforming loan amounts, which means it most likely represents lower-priced homes. FHFA also does not include cash buyers or jumbo loans, and these factors account for some of the differences in the two reports.
What’s the bottom line? Home values have hit new all-time highs according to Case-Shiller, FHFA, CoreLogic, Black Knight and Zillow, more than recovering from the downturn we saw in the second half of 2022. Prices are now on pace to appreciate between 6-8% this year depending on the index, based on the reported pace of appreciation through September. These indexes show that now remains a great opportunity for building wealth through homeownership and appreciation gains.
Continuing Jobless Claims Hit 2-Year High
Initial Jobless Claims rose by 7,000 in the latest week, with 218,000 people filing for unemployment benefits for the first time. The real story is Continuing Claims, which increased 86,000, showing that 1.927 million people are still receiving benefits after filing their initial claim. This is the first time Continuing Claims have topped 1.9 million in two years.
What’s the bottom line? Initial Jobless Claims remain relatively low on a historical basis, suggesting that employers are trying to hold on to workers. Yet, Continuing Claims have risen by 269,000 since September. This higher trend speaks to a weakening labor market, where it’s becoming harder for people to find employment once they are let go.
Family Hack of the Week
These Chocolate Chip Brownies from Allrecipes are a perfectly decadent way to mark National Brownie Day on December 8.
Preheat oven to 325 degrees Fahrenheit. Grease an 8-inch pan. Combine 1/2 cup sugar, 2 tablespoons butter, and 2 tablespoons water in a medium saucepan. Cook and stir over medium heat until boiling. Remove from heat and stir in 1 1/2 cups chocolate chips until melted and smooth. Mix in 2 large eggs and 1/2 teaspoon vanilla.
In a large bowl, combine 2/3 cup all-purpose flour, 1/2 teaspoon salt, and 1/4 teaspoon baking soda. Stir flour mixture into chocolate mixture.
Spread batter evenly into prepared pan and bake until top is dry and edges have started to pull away from the sides of the pan, around 20 to 25 minutes. Cool completely before cutting into squares.
What to Look for This Week
More housing appreciation data is ahead when CoreLogic’s Home Price Index for October is released on Tuesday.
Then labor sector reports will dominate the headlines, starting Tuesday with job openings via the JOLTS report for October. Look for November’s ADP Employment Report (which measures private payrolls) on Wednesday and the latest Jobless Claims on Thursday. Friday brings November’s Jobs Report from the Bureau of Labor Statistics, which includes Non-farm Payrolls and the Unemployment Rate.
Technical Picture
Mortgage Bonds ended last week trading above their 200-day Moving Average and just under a ceiling at 102.06. The 10-year is trading in the middle of a range with a ceiling at its 100-Day Moving Average and Support at the 4.056% Fibonacci Level.