
Week of July 4, 2022 in Review
A Tale of Two Jobs Reports
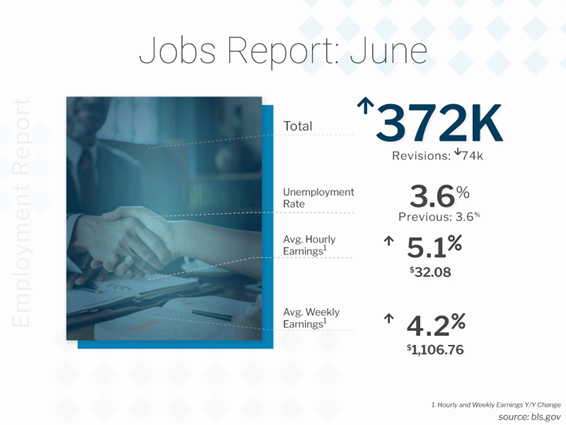
The Bureau of Labor Statistics (BLS) reported that there were 372,000 jobs created in June, which was stronger than expectations of 250,000 new jobs. However, there were negative revisions to the data for April and May removing 74,000 jobs in those months combined, which tempered the optimism slightly. The Unemployment Rate remained at 3.6% for the fourth month in a row.
Note that the headline unemployment rate removes people who are not actively searching for a job and there were almost 6 million people that are not being counted who “want a job” but have not looked in the last four weeks. The U-6 all-in unemployment rate, which adds back all these individuals and is more indicative of the true unemployment rate, decreased from 7.1% to 6.7%.
These strong headline figures may give the Fed the “green light” to hike its benchmark Fed Funds Rate 75 basis points at its meeting later this month, which would follow the 25, 50 and 75 basis point hikes they already made in March, May and June, respectively. Remember, the Fed has been hiking the Fed Funds Rate, which is the interest rate for overnight borrowing for banks and it is not the same as mortgage rates, to help cool inflation.
What’s the bottom line? While these headline figures looked strong, this is not the whole story.
There are two reports within the Jobs Report and there is a fundamental difference between them. The Business Survey is where the headline job number comes from and it’s based predominately on modeling. The Household Survey, where the Unemployment Rate comes from, is done by actual phone calls to 60,000 homes. The Household Survey also has a job loss or creation component, and it showed there were 315,000 job losses, which is a big discrepancy from the headline number.
In addition, the labor force decreased by 353,000. Since this is fairly close to the number of job losses that were reported, the unemployment rate remained the same – but for the wrong reasons. It was not due to strong job growth, but rather more people leaving the labor force than job losses.
Do Jobless Claims and Job Openings Signal a Slowdown?
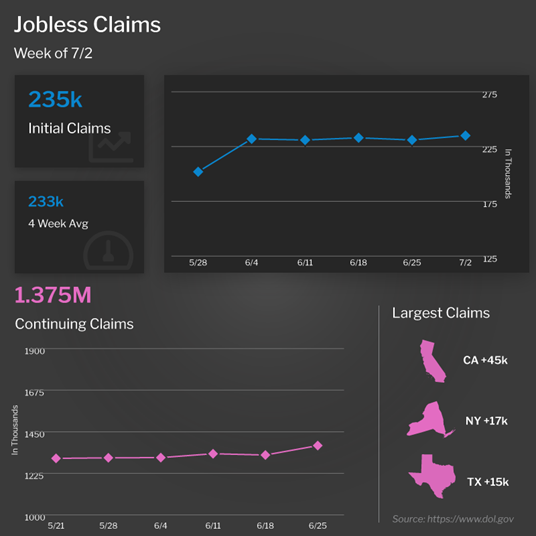
Initial Jobless Claims increased by 4,000 in the latest week, as 235,000 people filed for unemployment benefits for the first time. Continuing Claims, which measure people who continue to receive benefits after their initial claim is filed, rose by 51,000 to 1.375 million. This is the highest reading since late April.
What’s the bottom line? While Initial Jobless Claims remain low, the 4-week average is at the highest level since December and it has been consistently moving higher. This trajectory higher is likely to continue, given the announcements of significant layoffs from several public companies.
In addition, the Job Openings and Labor Turnover (JOLTS) survey showed that the total number of job openings dropped by 427,000 to 11.3 million in May. Though this is still a high level of job openings overall, the decline in openings could be another sign that companies are pausing on hiring and that the economy is slowing.
A Note on Private Sector Payroll Reporting
The ADP Employment Report, which measures private sector payrolls, would normally have been released last week, providing an update on job losses and creations in June. However, ADP announced that they are retooling the report to “provide a more robust, high-frequency view of the labor market and trajectory of economic growth.” In preparation for the changeover to the new report and methodology, they are pausing the current release and have targeted August 31, 2022 to reintroduce the new ADP National Employment Report.
Home Prices Up 20.2% Annually in May
CoreLogic released their Home Price Index report for May, showing that home prices rose by 1.8% from April and 20.2% on a year over year basis. This annual reading declined slightly from 20.9% in April but nearly matches the highest reading in the 45-year history of the index.
CoreLogic forecasts that home prices will appreciate 1% in June and 5% in the year going forward, but this is conservative compared to other forecasts and CoreLogic continues to miss forecasts by a large margin. For example, when we look to their report from last year at this time, they forecasted that home prices would increase 3.4% annually, while last week they reported that prices rose by more than 20%.
What’s the bottom line? Even if CoreLogic’s annual forecast is correct and home prices rise closer to 5% over the next year, this level of appreciation is still extremely meaningful for wealth creation. For example, if someone bought a $400,000 home and put 10% down, that means they would gain $20,000 in appreciation over the next year and earn a 50% return on their investment due to leverage.
Family Hack of the Week
July 11 is National Blueberry Muffin Day, which is why this recipe for Double Blueberry Muffins from the Food Network makes for an extra special treat.
Preheat oven to 375 degrees Fahrenheit. Grease a muffin tin or line with paper liners. In a small bowl, mix 2 tablespoons sugar with 1/4 teaspoon cinnamon and set aside.
In a mixer fitted with a paddle attachment, cream 8 tablespoons (1 stick) unsalted butter until smooth. Add 1 cup sugar and mix. Next mix in 2 eggs (1 at a time), 1 teaspoon pure vanilla extract, 2 teaspoons baking powder and 1/4 teaspoon salt. In a small bowl, mash 3/4 cup blueberries with the back of a fork, add to batter and mix.
Turn the mixer to low and add 1 cup flour and 1/4 cup milk. Mix well and then add remaining 1 cup flour and 1/4 cup milk. Fold in remaining 1 3/4 cups whole blueberries until well mixed.
Fill the muffin cups 3/4 full with the batter and sprinkle cinnamon-sugar mixture evenly on top. Bake until muffins are golden brown, approximately 25 to 30 minutes. Let cool in the pan for 30 minutes before removing and enjoy!
What to Look for This Week
Inflation data will be the big headliner this week, as June’s Consumer Price Index and Producer Price Index (which measures wholesale inflation) will be reported on Wednesday and Thursday, respectively.
Also of note, we’ll get a read on how small businesses were feeling last month when the National Federation of Independent Business Small Business Optimism Index is reported on Tuesday. The latest Jobless Claims data will be released as usual on Thursday. Plus, on Friday June’s Retail Sales and July’s manufacturing data for the New York region will show if there is more evidence of a slowdown.
Investors will also be closely watching Tuesday’s 10-year Note and Wednesday’s 30-year Bond auctions for the level of demand.
Technical Picture
Mortgage Bonds broke beneath support at the 25-day Moving Average after a stronger than expected Jobs Report on Friday. They ended last week trading in a wide range with the 25-day now acting as a ceiling of resistance and support at 99.28. The 10-year is currently battling with a ceiling of resistance at its own 25-day Moving Average. A break above this ceiling could mean the 10-year will move higher to retest the 3.25% level.