
Week of May 30, 2022 in Review
- What the Unemployment Rate Really Shows
- May Private Payrolls Much Lower Than Expected
- What’s Ahead for Jobless Claims?
- Home Prices in March 20.6% Higher Than a Year Ago
What the Unemployment Rate Really Shows
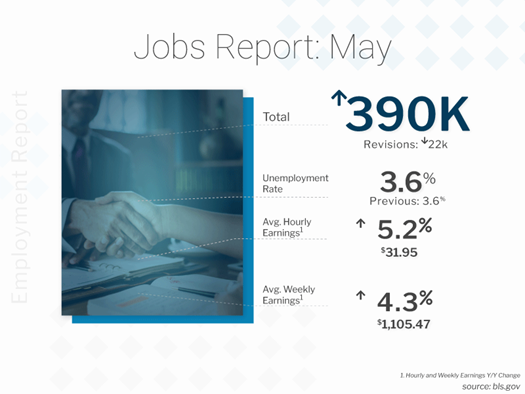
The Bureau of Labor Statistics (BLS) reported that there were 390,000 jobs created in May, which was stronger than expectations of 320,000 new jobs. However, there were negative revisions to the data for March and April removing 22,000 jobs in those months combined, which tempered the optimism slightly. The Unemployment Rate remained at a very strong 3.6% but did not decline to 3.5% as expected.
Note that there are two reports within the Jobs Report and there is a fundamental difference between them. The Business Survey is where the headline job number comes from and it’s based predominately on modeling. The Household Survey, where the Unemployment Rate comes from, is done by actual phone calls to 60,000 homes. The Household Survey also has a job loss or creation component, and it showed there were 321,000 job creations, while the labor force increased by 330,000. Since these numbers were fairly close to each other, the unemployment rate remained the same.
What’s the bottom line? The headline unemployment rate removes people who are not actively searching for a job and there were almost 6 million people that are not being counted who “want a job” but have not looked in the last four weeks. The U-6 all-in unemployment rate, which adds back all these individuals and is more indicative of the true unemployment rate, increased for the second month in a row, rising from 7% to 7.1%. This could be the “canary in the coal mine” on unemployment and a sign that things are slowing and we may have seen the low in unemployment.
May Private Payrolls Much Lower Than Expected
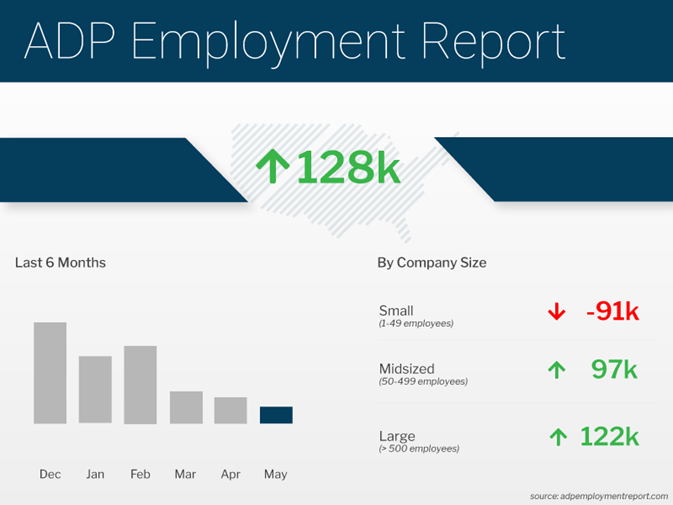
The ADP Employment Report, which measures private sector payrolls, showed that there were only 128,000 jobs created in May, which was much less than the 300,000 expected and the slowest gain of the recovery. In addition, job creations for April were revised lower from 247,000 to 202,000, eliminating 45,000 job gains in that month and adding to the weakness of this report.
What’s the bottom line? While mid-sized businesses (50-499 employees) gained 97,000 jobs and large businesses (500 or more employees) gained 122,000 jobs, small businesses (1-49 employees) lost 91,000 jobs after losing 120,000 in April. This shows that small businesses are having a tough time competing given the higher costs due to inflation and the wage increases demanded by workers. These economic conditions could contribute to more layoffs and Initial Jobless Claims in the future, but we are not seeing that just yet.
What’s Ahead for Jobless Claims?
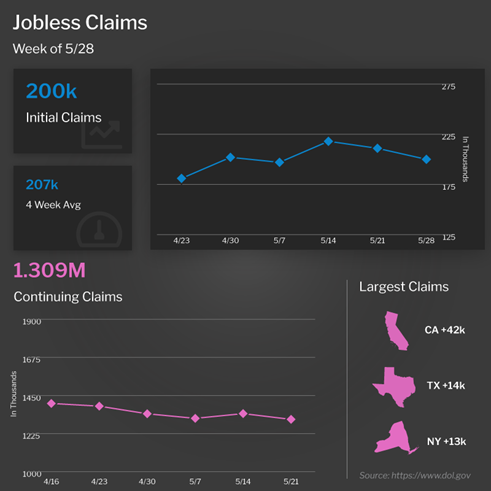
The number of people filing for unemployment benefits for the first time decreased by 11,000 in the latest week, as 200,000 Initial Jobless Claims were reported. Continuing Claims, which measure people who continue to receive benefits after their initial claim is filed, decreased 34,000 to 1.309 million. This is the lowest number of Continuing Claims since December 1969.
What’s the bottom line? While Initial Jobless Claims decreased in the latest week, the 4-week average is at the highest level since mid-February. Should the upward trajectory continue, it could be an early sign that unemployment will begin to rise, which is another recession indicator.
In addition, May’s Consumer Confidence Index showed that confidence in the labor market is declining, with the number of consumers saying jobs were “plentiful” falling from 54.8% to 51.8% while those who said jobs were “hard to get” rose from 10.1% to 12.5%. This could also be a sign that the job market is beginning to tighten.
Home Prices in March 20.6% Higher Than a Year Ago
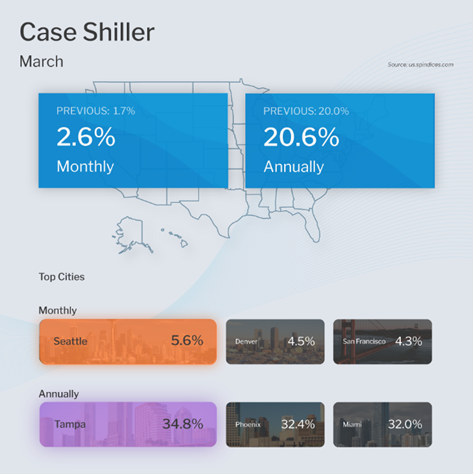
The Case-Shiller Home Price Index, which is considered the “gold standard” for appreciation, showed home prices rose 2.6% in March and 20.6% year over year. This annual reading is an increase from the 19.8% gain in the previous report.
The Federal Housing Finance Agency (FHFA) also released their House Price Index. This report measures home price appreciation on single-family homes with conforming loan amounts, which means it most likely represents lower-priced homes. Home prices rose 1.5% in March and 19% year over year, which is a slight decline from the 19.4% rise reported for February but still extremely hot.
Rents are also on the rise, as Apartment List’s National Rent Report showed that rents increased by 1.2% in May and 15.3% year over year. Note that this report is for new rents.
What’s the bottom line? While the Case-Shiller report is a bit dated since the reading is for March, there were no signs that appreciation was slowing earlier this year. In fact, if we annualized the monthly gain, appreciation would be over 30% for the year. This report does not fully take into account the rise in interest rates we have seen, so the data in the coming months will be important to analyze. But given that home price gains were still so strong through March, the data is supportive that we should still see home price gains, albeit at a slower pace.
Family Hack of the Week
Get your spoons ready. This Tuesday, June 7 is National Chocolate Ice Cream Day. Dive into this delicious homemade recipe from our friends at the Food Network, no ice cream maker required.
In a large bowl, whisk together one 14-ounce can sweetened condensed milk, 1/2 cup unsweetened natural cocoa powder, 1 teaspoon pure vanilla extract, and a pinch of fine salt. The mixture will become thick. Set aside.
Whip together 2 cups cold heavy cream with a mixer on medium-high until firm peaks form, approximately 2 minutes. Using a rubber spatula, fold 1 cup of the whipped cream into the cocoa mixture until combined, then fold that mixture into the remaining cup whipped cream until well blended.
Pour into a chilled 9-by-5-by-3-inch metal loaf pan. Cover and freeze for about 2 hours, until the ice cream resembles soft-serve. Swirl in any of your favorite mix-ins, such as peanut butter and peanut butter candies, almonds and marshmallows, or chocolate chips. Cover and freeze until solid and scoopable, around another 3 hours.
What to Look for This Week
The economic calendar is relatively quiet, with the biggest report coming Friday when the Consumer Price Index will give us an update on inflation in May. The latest Jobless Claims data will also be reported as usual on Thursday.
Investors will also be closely watching Wednesday’s 10-year Note and Thursday’s 30-year Bond auctions for the level of demand.
Technical Picture
Mortgage Bonds ended last week still battling their 25-day Moving Average. A break above could lead to Mortgage Bonds testing their 50-day Moving Average. If they fall beneath their 25-day Moving Average, the next level of support is at 101.06. The 10-year is trading at around 2.94% in a tight range between the floor at 2.92% and a ceiling at 3.01%.