
Week of May 15, 2023 in Review
Recent data shows the impact that low supply is having on the housing market, while unemployment claims continue to reflect a slowdown in hiring. Don’t miss these stories:
- Tight Supply Takes the Spring Out of Existing Home Sales
- Home Builder Confidence Reaches Key Threshold
- “Gradual Improvement” In Single-family Construction
- Unemployment Claims Trending Higher Despite Weekly Decline
- Weakness in Manufacturing, Retail Sales and Leading Indicators
Tight Supply Takes the Spring Out of Existing Home Sales
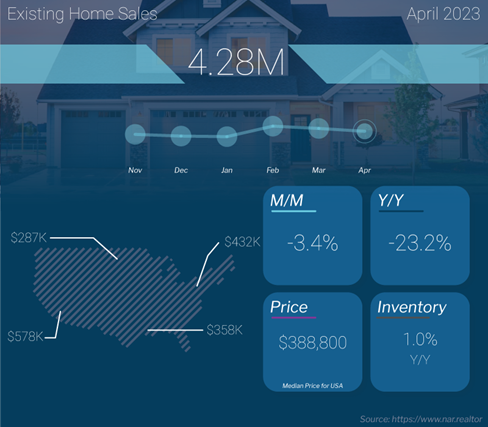
Existing Home Sales fell 3.4% from March to April to a 4.28 million unit annualized pace, per the National Association of Realtors (NAR). Sales were also 23.2% lower than they were in April of last year. This report measures closings on existing homes, which represent around 90% of the market, making it a critical gauge for taking the pulse of the housing sector.
What’s the bottom line? Tight supply is the key reason for the decline in sales around the country. While total housing inventory increased 7.2% from March to 1.04 million homes available at the end of April, it remains well below normal with just 2.9 months’ supply available at the current sales pace.
In addition, multiple data points suggest that demand remains strong. Homes stayed on the market on average for 22 days, down sharply from 29 days in March. Plus, 73% of homes sold in April were on the market for less than a month, which is up from 65% and shows homes are selling quickly when they’re priced correctly. Meanwhile, investors accounted for 17% of transactions last month, making up roughly one out of every six deals. Clearly investors are seeing the opportunity in housing right now.
Also of note, the median existing-home price fell 1.7% to $388,800 from a year earlier. However, this is not the same as a decline in home prices as some media reports implied. The median home price simply means half the homes sold were above that price and half were below it, and this figure can be skewed by the mix of sales among lower-priced and higher-priced homes. Actual appreciation numbers are higher, not lower, on a year-over-year basis and are showing acceleration according to key reports from Case-Shiller, CoreLogic and the Federal Housing Finance Agency.
Home Builder Confidence Reaches Key Threshold
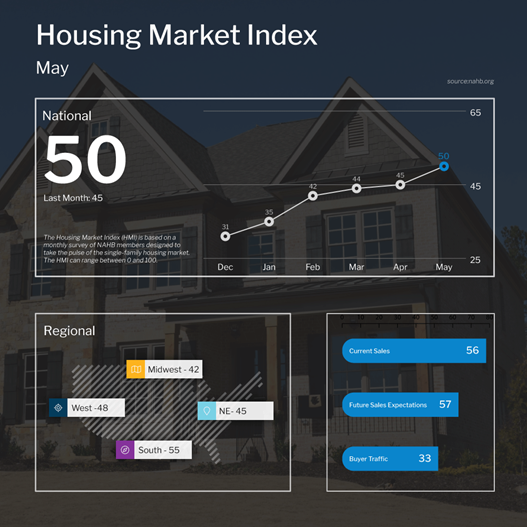
The National Association of Home Builders (NAHB) Housing Market Index, which is a near real-time read on builder confidence, rose five points to 50 in May. Any reading above 50 on this index, which runs from 0 to 100, signals expansion while readings below 50 signal contraction. May’s reading marks the fifth straight month this measure has increased and the first time builder sentiment has hit this important midpoint since July 2022.
All three components of the index posted gains, with current sales conditions rising five points to 56, sales expectations for the next six months up seven points to 57, and buyer traffic moving two points higher to 33.
What’s the bottom line? Home builder confidence overall has now risen 19 points since the low of 31 in December. The buyer traffic component has also made a big recovery since reaching a low of 20 last November. NAHB Chief Economist Robert Dietz noted the “lack of existing inventory continues to drive buyers to new construction.” Home builders are also continuing to use incentives to appeal to homebuyers.
“Gradual Improvement” In Single-family Construction
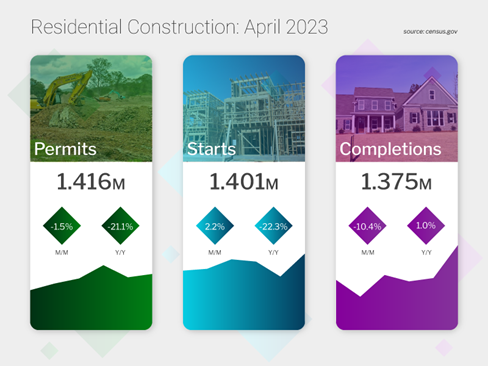
Construction of new homes ticked higher in April, with Housing Starts rising 2.2% from March. However, Building Permits, which are indicative of future supply, fell 1.5% for the month. While Starts and Permits for single-family homes rose from March to April, they were both significantly lower than in April of last year.
What’s the bottom line?
While NAHB Chair Alicia Huey noted that “single-family starts are showing gradual improvement from the beginning of the year,” the housing sector is undersupplied and not enough inventory is heading to the market. Starts for single-family homes have declined from a pace of 1.176 million units in April 2022 to 846,000 units this April. Single-family permits have followed the same pattern, declining from 1.085 million units to 855,000 over the same period.
With single-family homes remaining in high demand among buyers, the imbalance between supply and demand should continue to be supportive of prices.
Unemployment Claims Trending Higher Despite Weekly Decline
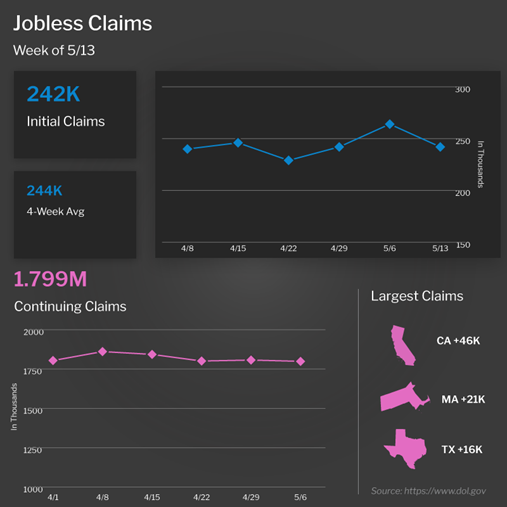
Initial Jobless Claims fell by 22,000 in the latest week, as 242,000 people filed for unemployment benefits for the first time. While this sounds like positive news on the surface, part of the decline stems from fraud in Massachusetts that spiked the numbers in the previous week. Continuing Jobless Claims also declined slightly by 8,000 to 1.799 million. This figure measures people who continue to receive benefits after their initial claim is filed.
What’s the bottom line? Jobless Claims data can be volatile from week to week, so it’s important to look at the overall trend, which continues to reflect rising unemployment. For example, the four-week average of Initial Jobless Claims, which smooths out some of the weekly fluctuation among first-time filers, reached the second highest level of the year at 244,250.
Meanwhile, Continuing Claims have risen by more than 500,000 since the low reached last September, and they’re also up 165,000 since the start of the year. This metric remains at some of the highest levels seen in some time and is a clear sign that hiring has slowed.
Weakness in Manufacturing, Retail Sales and Leading Indicators
May brought more negative readings (which signal contraction) reported for manufacturing in the New York and Philadelphia regions. The Empire State Index contracted sharply to -31.8, which was much worse than estimates, while the Philadelphia Fed Index remained in contraction territory for the ninth straight month. These reports suggest that the manufacturing sector is already experiencing recession-like conditions.
Meanwhile, Retail Sales rose 0.4% in April but this was just half of market estimates. Sales increased 0.5% over the last year, which is the lowest growth rate in three years and well below the historical average of 4.8%. After adjusting for inflation, however, the story is far worse. Real retail sales have fallen 4.2% over the last year, marking the sixth consecutive year-over-year decline.
The Conference Board also released their Leading Economic Index (LEI) for April, which was down 0.6%. This latest deterioration followed the 1.2% drop in March and marked the thirteenth consecutive month of declines. The LEI provides an early indication of turning points in the business cycle, reflecting where the economy is heading in the near term. Justyna Zabinska-La Monica, Senior Manager, Business Cycle Indicators, noted that “the Conference Board forecasts a contraction of economic activity starting in Q2 leading to a mild recession by mid-2023.”
Family Hack of the Week
Friday, May 26 marks National Cherry Dessert Day. This Cherry Crumble recipe from the Food Network is perfect for enjoying all weekend long.
Preheat oven to 400 degrees Fahrenheit. In a saucepan, combine 6 cups tart red cherries (pitted), 1 1/4 cups sugar, 1/4 cup water and 4 teaspoons cornstarch. Stir until bubbling and thickened. Pour into an 8-inch square baking dish.
In a large bowl, stir together 1 cup flour, 1/4 cup sugar, 2 tablespoons brown sugar, 1 teaspoon baking powder and 1/2 teaspoon cinnamon. Cut in 3 tablespoons butter until mixture forms coarse crumbles. In a small bowl, mix together 1 egg and 3 tablespoons milk. Add milk mixture to flour mixture and stir until just combined. Drop topping by tablespoonfuls onto filling.
Bake for 25 minutes until the topping is browned and fruit is bubbling. Enjoy warm with your favorite vanilla ice cream.
What to Look for This Week
More housing reports are ahead, with April’s New and Pending Home Sales releasing on Tuesday and Thursday, respectively. Also on Thursday, look for the latest Jobless Claims data along with the second reading for first quarter 2023 GDP.
The minutes from the Fed’s May meeting will be released Wednesday and these always have the potential to move the markets. Ending the week, Friday brings perhaps the biggest news with April’s reading for the Fed’s favored inflation measure, Personal Consumption Expenditures.
Technical Picture
Mortgage Bonds ended last week in the middle of a wide range between support at 99.845 and resistance at 100.281. The 10-year broke above its ceiling at 3.644%, which is a negative technical sign. Yields are in a new range, with the next ceiling at 3.786% if they cannot get back under the aforementioned level.