
Week of February 13, 2023 in Review
- Mild Progress on Consumer Inflation
- Wholesale Inflation Hotter Than Expected
- Household Formations Continue to Outpace Completions
- Builder Confidence Rose for Second Straight Month
- Continuing Jobless Claims Continue to Creep Higher
- Was the Rebound in Retail Sales an Anomaly?
Mild Progress on Consumer Inflation
The Consumer Price Index (CPI), which measures inflation on the consumer level, showed that inflation increased by 0.5% in January. On an annual basis, inflation declined from 6.5% to 6.4%. While the monthly reading was in line with estimates, the year-over-year figure was hotter than expectations. Core CPI, which strips out volatile food and energy prices, rose 0.4% while the year-over-year index decreased from 5.7% to a hotter than forecasted 5.6%.
In addition, shelter costs make up 43% of Core CPI and they rose 0.7% in January, meaning they played a big role in the overall 0.4% monthly gain in Core CPI. However, shelter costs have been lagging in the CPI report, as they have been coming down in more real-time data. Once these moderating shelter costs are reflected in the CPI data, they should add additional downside pressure to inflation.
What’s the bottom line? Inflation is the arch enemy of fixed investments like Mortgage Bonds because it erodes the buying power of a Bond’s fixed rate of return. If inflation is rising, investors demand a rate of return to combat the faster pace of erosion due to inflation, causing interest rates to rise as they did throughout much of last year. Since lower inflation typically helps both Mortgage Bonds and mortgage rates improve, these signs of easing inflation are welcome, mild though they were.
Wholesale Inflation Hotter Than Expected
The Producer Price Index (PPI), which measures inflation on the wholesale level, rose by a greater than expected 0.7% in January. On a year-over-year basis, PPI decreased from an upwardly revised 6.5% to 6%. Core PPI, which strips out volatile food and energy prices, rose to a hotter than expected 0.5%. On an annual basis, Core PPI declined from an upwardly revised 5.8% to 5.4%.
What’s the bottom line? These inflation readings were disappointing because they were higher than expected, but inflation is still subsiding and the annual readings are moving lower in the right direction. In fact, the progress made on the producer side of inflation is notable. At its peak last March, PPI was at 11.6% year over year and is now almost half that amount at 6%.
Household Formations Continue to Outpace Completions
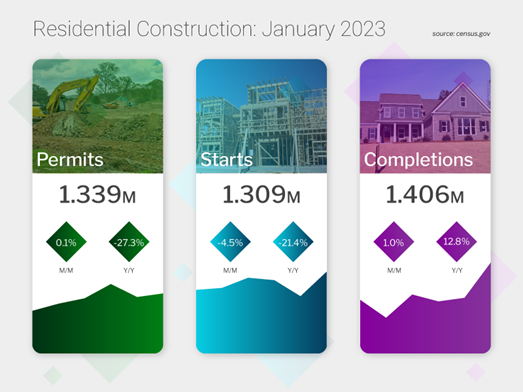
The start of the new year brought a chill to homebuilding as Housing Starts, which measure the start of construction on homes, fell 4.5% from December to January. More significantly, starts for single-family homes declined 4.3% from December and 27.3% from January of last year. Building Permits for single-family homes, which are indicative of future supply, also fell 1.8% for the month and 40% year over year. This is a disappointment because single-family homes are in such high demand among buyers and the data suggests ongoing tight supply will continue.
What’s the bottom line? Builders are on pace to complete 1.406 million homes this year, yet household formations are projected to total 1.9 million. This ongoing disparity between supply and demand should continue to be supportive of prices, especially when we see more hibernating buyers resume their home search. The dynamics in today’s market are very different from the housing bubble, where demand was waning but the supply of new homes was significantly increasing.
Builder Confidence Rose for Second Straight Month
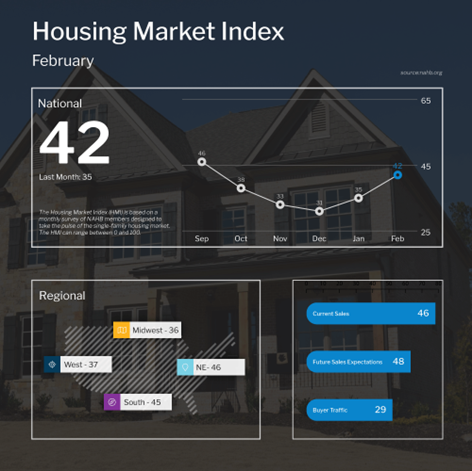
The National Association of Home Builders (NAHB) Housing Market Index, which is a near real-time read on builder confidence, rose seven points to 42 in February. All three components of the index posted gains, with current sales conditions rising six points to 46, sales expectations for the next six months up eleven points to 48, and buyer traffic moving six points higher to 29. Any reading above 50 on this index, which runs from 0 to 100, signals expansion while readings below 50 signal contraction.
What’s the bottom line? The rise in confidence among home builders in both January and February of this year follows declines seen every month last year. February’s reading also marks the strongest one-month gain in 10 years. This could signal the start of an upward trend, which would be encouraging for buyers facing limited supply. NAHB Chief Economist Robert Dietz noted, “While the HMI remains below the breakeven level of 50, the increase from 31 to 42 from December to February is a positive sign for the market.”
Continuing Jobless Claims Continue to Creep Higher
The latest Initial Jobless Claims data showed that 194,000 people filed for unemployment benefits for the first time, which is a decline of 1,000 from the previous week. Continuing Claims, which measure people who continue to receive benefits after their initial claim is filed, rose 16,000 to 1.696 million, the highest amount since the latter part of December.
What’s the bottom line? We are continuing to see a tight labor market where companies are doing their best to hold on to workers. However, Continuing Claims have risen by 350,000 since the low reached last September, which also suggests it’s becoming harder for many to find a job if they are let go.
Was the Rebound in Retail Sales an Anomaly?
After the disappointing holiday shopping season in November and December, Retail Sales rebounded in January, rising a much higher than expected 3%. Interestingly, much of the gain came from department stores, where sales rose almost 18%. Were shoppers returning holiday gifts and purchasing items while they were in the store? Did warmer than expected weather around the country play a role? This figure was an outlier and is worth monitoring in next month’s report.
Family Hack of the Week
Winter is the perfect season for baking. These Blueberry Scones courtesy of Taste of Home are a perfectly delicious afternoon treat.
Preheat oven to 375 degrees Fahrenheit. Spray a baking sheet with baking spray.
In a large bowl, combine 4 cups all-purpose flour, 6 tablespoons sugar, 4-1/2 teaspoons baking powder and 1/2 teaspoon salt. Cut in 1/2 cup plus 2 tablespoons cold butter until mixture resembles coarse crumbs. In a small bowl, whisk 2 large eggs (room temperature) and 3/4 cup whole milk. Add milk mixture to crumb mixture until just moistened.
Turn dough onto a lightly floured surface and gently knead in 1-1/2 cups fresh or frozen blueberries. Pat into an 8-inch circle and cut into 8 wedges. Place on prepared baking sheet and brush with 2 tablespoons milk.
Bake for 15 to 20 minutes or until scones are golden brown on top. Enjoy warm with a cup of tea.
What to Look for This Week
After the market closures Monday for the Presidents Day holiday, important housing and inflation reports are ahead.
Existing Home Sales for January will be reported on Tuesday, while New Home Sales follow on Friday. On Thursday, look for the latest Jobless Claims data along with the second reading for fourth quarter 2022 GDP. Friday brings January’s reading for the Fed’s favored inflation measure, Personal Consumption Expenditures.
The minutes from the Fed’s latest meeting will also be released on Wednesday and these always have the potential to be market moving.
Technical Picture
Mortgage Bonds were able to remain above the important floor at 99.845 last Friday and they ended last week trading in a range between the 99.845 floor and a ceiling at their 100-day Moving Average. The 10-Year was rejected from the ceiling at the 3.908% Fibonacci level and has moved lower.