
Week of January 24, 2022 in Review
The Fed’s favorite measure of inflation, Personal Consumption Expenditures (PCE), showed that headline inflation rose 0.4% in December, which was in line with expectations. Year over year, the index increased from 5.7% to 5.8%. Core PCE, which strips out volatile food and energy prices and is the Fed’s real focus, was up 0.5% while the year over year reading increased from 4.7% to 4.9%. Both annual inflation readings are the hottest in roughly 40 years!
Rising inflation is crucial to monitor and that’s a big reason why investors were closely watching the Fed’s Monetary Policy Statement and press conference on Wednesday afternoon for guidance about how the Fed plans to address this. Don’t miss our important breakdown below.
In housing news, demand for homes around the country remains strong, with sales of news homes up nearly 12% from November to December. Interestingly, most of the increase in December’s sales were in the category of “homes sold not started,” which speaks to the backlog builders are facing. Pending Home Sales, which measure signed contracts on existing homes, did come in below expectations in December. However, sales were still quite strong considering the holiday season, rise of Omicron cases, and record low inventory levels.
This dynamic of strong demand and low inventory around the country continues to help home prices appreciate. The Case-Shiller Home Price Index showed that home prices rose 0.9% in November and 18.8% year over year. The Federal Housing Finance Agency (FHFA), which measures home price appreciation on single-family homes with conforming loan amounts, also reported that home prices rose 1.1% in November and were up 17.5% year over year.
Lastly, the advanced or first reading for GDP in the fourth quarter of last year showed that the US economy grew by 6.9% annualized. There are a few caveats to note about this reading, as highlighted below.
Annual Inflation Reaches Hottest Level in 40 Years
The Fed’s favorite measure of inflation, Personal Consumption Expenditures (PCE), showed that headline inflation rose 0.4% in December, which was in line with expectations. This caused the year over year reading to increase from 5.7% to 5.8%.
Core PCE, which strips out volatile food and energy prices and is the Fed’s real focus, was also in line with estimates as it was up 0.5%. The year over year reading increased from 4.7% to 4.9%. Both annual inflation readings are the hottest in roughly 40 years!
Annual inflation will likely continue to increase, as the next two monthly readings that we will be replacing from January and February 2021 are 0.3%. If the readings for January and February of this year are above this level, the year over year figures will increase.
Wage growth is contributing to inflation but is offsetting it to a degree. Incomes were up 0.3% in December and private sector wages were up by 0.8%. If you were to annualize the past six months, private sector wages are up 10% annually. This is a good thing for affordability on homes.
Remember, inflation is the arch enemy of fixed investments like Mortgage Bonds because it erodes the buying power of a Bond’s fixed rate of return. If inflation is rising, investors demand a rate of return to combat the faster pace of erosion due to inflation, causing interest rates to rise. This is why keeping an eye on inflation remains critical.
Market Volatility Follows First Fed Meeting of the Year
The Fed held its first two-day Federal Open Market Committee meeting of the year, with their Monetary Policy Statement and press conference coming on Wednesday afternoon. Investors were closely watching both for guidance regarding how the Fed plans to address rising inflation.
Note that the Fed has two levers that they can pull for tightening the economy – hiking their benchmark Fed Funds Rate and reducing their balance sheet. The Fed Funds Rate is the interest rate for overnight borrowing for banks and it is not the same as mortgage rates.
Hiking the Fed Funds Rate will actually be a good thing for mortgage rates, as the Fed curbs inflation and preserves the fixed return a longer data Bond provides. However, reducing their balance sheet (which means allowing Bonds to fall off their balance sheet and no longer reinvesting in them each month) would cause more supply on the market that has to be absorbed. This can cause mortgage rates to move higher.
Initially, the Fed statement that was released on Wednesday appeared to be more dovish than the markets expected, sparking a rally in the equity markets. The Fed appeared to be less aggressive in removing accommodation than the markets anticipated, with no mention of the number of hikes to the Fed Funds Rate or balance sheet runoff.
The Fed then released a second statement regarding the balance sheet runoff, explaining how after they hiked the Fed Funds Rate, they were going to begin QT (Quantitative Tightening or reducing the balance sheet). But they did not give an idea of when or by how much. Once Bonds got wind of this, they sold off sharply on Wednesday.
However, things changed for the equity markets during Fed Chair Jerome Powell’s press conference, as it was clear he had a very hawkish tone. Powell stressed how strong the economy was, how broad and fast the wage upturn has been, and how we are in a much stronger economic situation than when we started tightening in 2015.
Meanwhile, we have been seeing growth and sales slow, and while the labor market has been showing gains, that is expected after a pandemic and the participation rate is incredibly low. Powell believes the slowdown is all Omicron related and made it clear that the primary (and really only) concern was inflation risk to the upside.
Powell also said that the Fed has no control over the yield curve, which sounds like the Fed is going to go full steam ahead on hiking the Fed Funds Rate, regardless of if it flattens and sends the US into a recession.
Again, as noted above, hiking the Fed Funds Rate will actually be a good thing for mortgage rates, as the Fed curbs inflation and preserves the fixed return a longer data Bond provides.
The bottom line is that the Fed’s actions remain crucial to monitor in the months to come, as they will play an important role in the direction of the markets and mortgage rates this year.
New and Pending Home Sales Show Strong Demand Remains
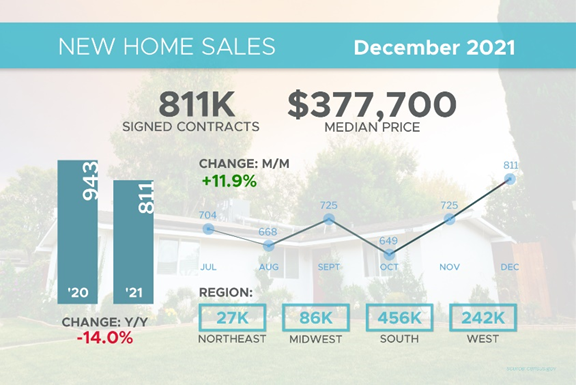
New Home Sales, which measure signed contracts on new homes, were up nearly 12% from November to December at an 811,000 annualized pace. This was much stronger than expectations of a 1.7% gain. Sales for November were revised lower from 744,000 to 725,000 and when factoring this in, sales were still up a solid 9%. Year over year, sales were down 14%.
The median home price came in at $377,700, which is a decline of almost 10% from November. Note that the median home price is not the same as appreciation. It simply means half the homes sold were above that price and half were below it. The median home price is up 3.4% year over year and points to an increase in lower-priced homes sold. There was a big increase in homes sold between $200,000 to $300,000, which is a good sign especially for first-time buyers.
Interestingly, most of the increase in December’s sales were in the category of “homes sold not started,” which speaks to the backlog builders are facing.
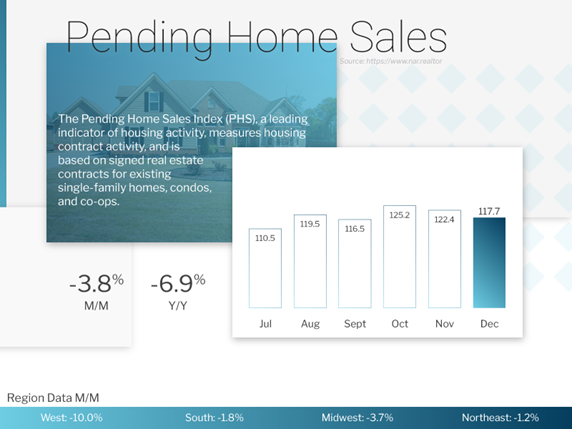
Also of note, Pending Home Sales, which measure signed contracts on existing homes, came in below expectations, falling 3.8% in December. Though sales were down 6.9% year over year, they are still quite strong considering the holiday season, rise of Omicron cases, and record low inventory levels. Quite simply, if there were more homes for sale, we would have seen more contracts signed.
Home Price Appreciation Continues
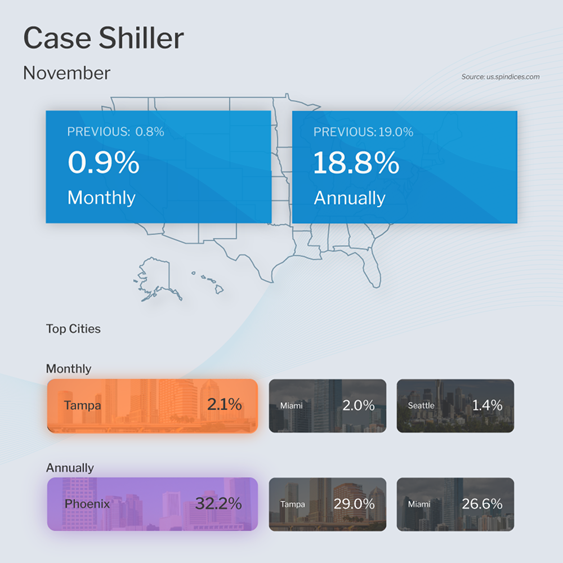
The Case-Shiller Home Price Index, which is considered the “gold standard” for appreciation, showed home prices rose 0.9% in November and 18.8% year over year. This annual reading was slightly lower than the 19% increase reported for October.
This data points to two important questions. Why are the year over year appreciation figures declining? Does this mean home prices are moving lower?
The pace of appreciation month over month is decelerating, but we are still seeing home price gains. For example, in November 2020 home prices rose 1.3% while in November 2021 they rose 0.9%. Because the data for November 2021 shows a slower pace of appreciation then what was reported for November 2020, the year over year figure declined. But home prices are still increasing.
The top three performing cities were Phoenix (+32%), Tampa (+29%) and Miami (+27%). Even the three worst-performing cities, including Chicago, Minneapolis, and Washington, saw roughly 11% gains.
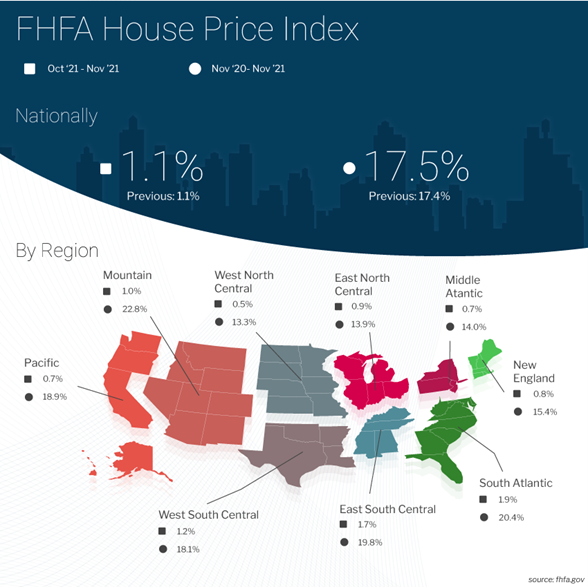
The Federal Housing Finance Agency (FHFA) also released their House Price Index, which measures home price appreciation on single-family homes with conforming loan amounts. While you can have a million-dollar home with a conforming loan amount, the report most likely represents lower-priced homes, where supply has been tight and demand strong.
Home prices rose 1.1% in November and were up 17.5% year over year, which is slightly higher than the 17.4% annual reading reported for October.
Initial Jobless Claims Move Lower After Recent Rise
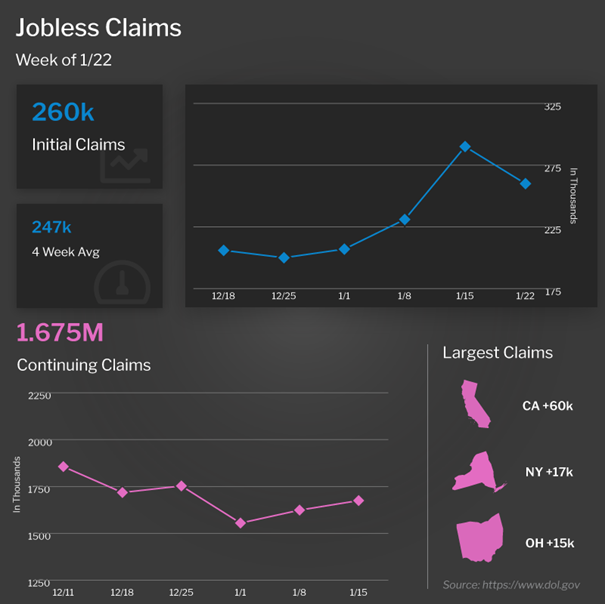
After increasing over the last few weeks, the number of people filing for unemployment benefits for the first time fell by 30,000 to 260,000. While we don’t know definitively how much of the recent rise was due to Omicron, with COVID cases declining we should get a clearer picture in the coming weeks.
Continuing Claims, which measure people who continue to receive benefits after their initial claim is filed, rose 51,000 to 1.675 million.
There are now 2.14 million people in total receiving benefits, and while this is an increase of 8,400 in the latest week, it is still a stark contract to the nearly 19 million people receiving benefits in the comparable week the previous year.
A Note on GDP
The advanced or first reading for GDP in the fourth quarter of last year showed that the US economy grew by 6.9% annualized. This was stronger than the 6% expected and follows a 2.3% print in the third quarter.
There are a few things to note about this reading. First, it does not mean that we saw 6.9% growth in the fourth quarter. The real number was 1.725% but that figure is annualized or multiplied by 4.
In addition, much of the growth was inventory build ahead of the holidays, which added 4.9% to the reading. There were likely a lot of double and triple orders due to ongoing supply chain issues, which means that first quarter 2022 GDP will likely moderate significantly.
Family Hack of the Week
These Oatmeal Raisin Cookies courtesy of Martha Stewart are not only easy to make, they make for a delicious afternoon treat.
Preheat oven to 350 degrees Fahrenheit. Line two baking sheets with parchment paper.
In a medium bowl, whisk together 1/2 cup whole wheat flour, 1/2 cup all-purpose flour (both spooned and leveled) and 1 teaspoon baking powder.
In a large bowl, whisk together 1/3 cup vegetable oil, 2/3 cup packed dark brown sugar, 1 large egg and 1 teaspoon pure vanilla extract. Add the flour mixture and stir to combine. Stir in 1/2 cup rolled oats and 1/2 cup raisins or dried currants.
Use two tablespoons of dough per cookie and roll into balls. Place on prepared baking sheets 1 1/2 inches apart. Bake until lightly browned, approximately 15 to 17 minutes, rotating baking sheets halfway through.
Cool for five minutes on baking sheets before transferring cookies to a wire rack to cool completely. Enjoy with your afternoon coffee or tea!
What to Look for This Week
The week kicks off with important manufacturing news on Monday when the Chicago PMI for January is reported. January’s ISM Index follows on Tuesday.
Tuesday also brings more news on home price appreciation when CoreLogic releases its December Home Price Index report
Then investors will be closely watching labor sector data, beginning Wednesday when the ADP Employment Report will give us an update on private payrolls for January. Thursday brings the latest Initial Jobless Claims data.
Ending the week on Friday, the highly anticipated Bureau of Labor Statistics Jobs Report for January will be released, which includes Non-farm Payrolls and the Unemployment Rate.
Technical Picture
Mortgage Bonds ended last week trading just near overhead resistance at 102.198 with support all the way down at 101.578. The 10-year remains in a wide range between 1.88% and 1.77%.