
Week of January 17 -23, 2022 in Review
Sales of existing homes fell by 4.6% from November to December to an annualized pace of 6.2 million units. But the real story was record-low inventory. There were only 910,000 homes for sale at the end of December, which is down significantly from the 1.1 million homes that were available at the end of November.
Homes were only on the market for 19 days, even with higher prices and the lack of inventory, which speaks to the high demand for homes among potential buyers around the country. The ongoing tight supply and strong demand should be very supportive of home prices.
The high demand for homes has kept builders confident even in the face of higher building material costs and the lack of skilled labor. Builder confidence fell 1 point to 83 in January per the National Association of Home Builders Housing Market Index. Any reading over 50 on this index, which runs from 0 to 100, signals expansion so confidence remains at a strong level despite the slight decline.
Meanwhile, Housing Starts, which measure the start of construction on homes, rose by almost 1.4% in December to an annualized pace of 1.702 million homes. However, starts for single-family homes, which are the most important because they are in such high demand among buyers, fell by 2.3% from November to December and they were also nearly 11% lower than they were in December 2020.
On the positive front, Building Permits, which are a good forward-looking indicator for Housing Starts, increased for single-family homes and overall as well in December. Yet, one of the main takeaways is that the backlog of homes continues to grow. Homes authorized but not yet started increased by 1.1% and were up 44% year over year. Single-family homes authorized but not yet started were up nearly 39% year over year.
Rental prices were also on the rise, as CoreLogic’s Single-family Rent Report showed they increased 11.5% year over year in November – the fastest increase in over 16 years. All of the metros saw rental increases, but Miami was the clear leader with rental prices up 33%, showing the demand to escape to the warmer climates of Florida for the winter.
There was important news to note from the manufacturing sector. While the Philadelphia Fed Index showed that manufacturing grew more than expected in that region, the Empire State Index, which measures manufacturing activity for the New York region, fell sharply from 32 in December to -0.7 in January. This was well below the estimate of 25.
Was this decline in the New York region due to Omicron impacting supply chains, a hangover after the holidays, cost pressures or rising wages? It is likely a combination of all of these factors and is something we need to monitor, as it could be signaling a slowdown in our economy.
Omicron’s impact on the labor sector was also reflected in the latest Initial Jobless Claims figures, which reached the highest level since October. The number of people continuing to receive benefits after their initial claim also increased. There are now 2.128 million people in total receiving benefits, and while this is an increase of 180,000 in the latest week, it is still a stark contract to the nearly 17 million people receiving benefits in the comparable week the previous year.
Lastly, Wednesday’s 20-Year Bond Auction was met with above average demand. The bid to cover of 2.48 was higher than the one-year average of 2.36. Direct and indirect bidders took 83.2% of the auction compared to 79.1% in the previous 12.
Record Low Inventory of Existing Homes
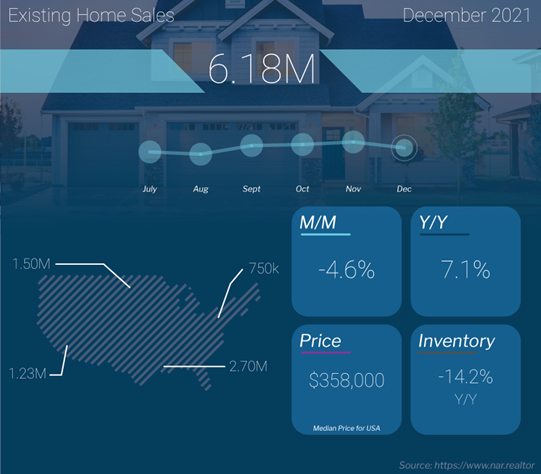
Existing Home Sales, which measure closings on existing homes, fell by 4.6% from November to December to an annualized pace of 6.2 million units. On a year over year basis, sales were down 7.1%.
But the real story here is record-low inventory. There were only 910,000 homes for sale at the end of December, which is down significantly from the 1.1 million homes that were available at the end of November. Inventory is 14% lower than it was in December 2020 and a completely different picture compared to the bubble-like conditions we saw in 2007 when there were 3.7 million homes for sale.
Homes were only on the market for 19 days in December, even with higher prices and the lack of inventory, which speaks to the high demand for homes among potential buyers around the country. The real reason we saw sales decline is because there are not enough homes on the market. Quite simply, if there were more homes, there would be more sales. The ongoing tight supply and strong demand should be very supportive of home prices.
The median home price was reported at $358,000, which is up 15.8% year over year. Remember that the median home price is not the same as appreciation. It simply means half the homes sold were above that price and half were below it.
First-time homebuyers accounted for 30% of sales, which was a big rise from 26% in November’s report. Cash buyers declined slightly to 23% of transactions, down from 24% in November, while investors purchased 17% of homes, up from 15%. Foreclosures and short sales comprised less than 1% of all transactions.
Builder Confidence Ticks Lower But Remains Strong
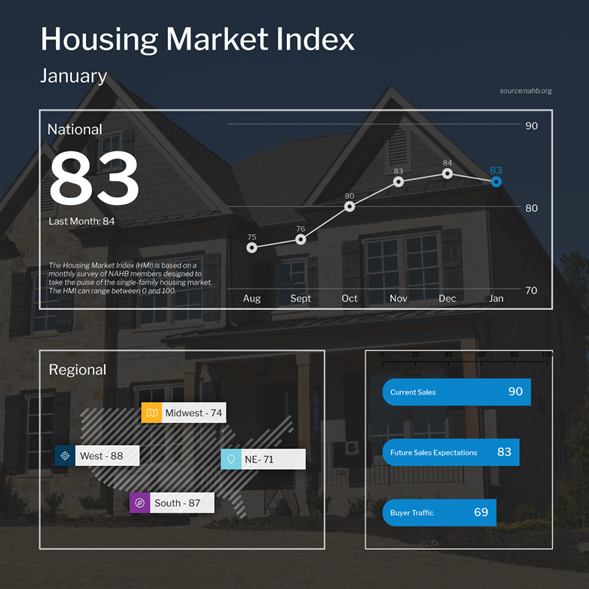
The National Association of Home Builders Housing Market Index, which is a real-time read on builder confidence, fell 1 point to 83 in January but remains at a strong level.
Any reading over 50 on this index, which runs from 0 to 100, signals expansion. For perspective, this index was at 80 last October, 83 in November and reached an all-time high of 90 in November 2020.
Looking at the components of the index, current sales conditions held steady at 90, sales expectations for the next six months fell 2 points to 83, and buyer traffic also dropped 2 points to 69.
NAHB Chairman, Chuck Fowke, noted that, “Higher material costs and lack of availability are adding weeks to typical single-family construction times. NAHB analysis indicates the aggregate cost of residential construction materials has increased almost 19% since December 2020.”
The bottom line is that the high demand for homes has kept builders confident even in the face of higher building material costs and the lack of skilled labor.
Housing Starts Move Higher But Construction Backlog Remains
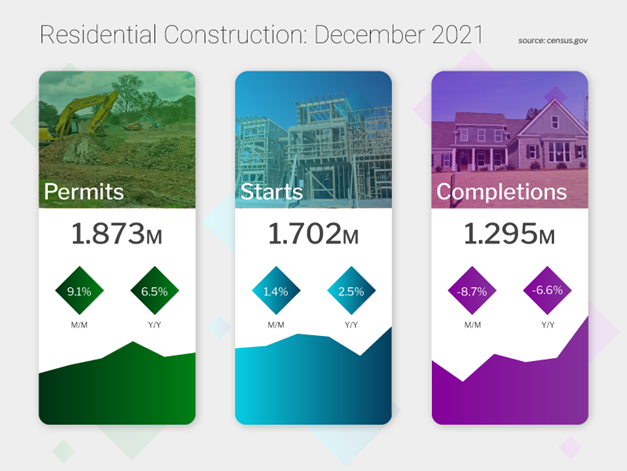
Housing Starts, which measure the start of construction on homes, rose by almost 1.4% in December to an annualized pace of 1.702 million homes. This is 2.5% higher than December 2020.
However, starts for single-family homes, which are the most important because they are in such high demand among buyers, fell by 2.3% from November to December. They are also nearly 11% lower than they were in December 2020.
Building Permits, which are a good forward-looking indicator for Housing Starts, rose by 9.1% in December and they were also are up 6.5% year over year. Single-family permits also increased by 2%, but they were still down 8.5% annually.
One of the main takeaways is that the backlog of homes continues to grow. Completions fell by almost 9% in December and they were down 6.6% annually, speaking to the challenges builders are having with materials and labor.
In addition, homes authorized but not yet started increased by 1.1% and they were up 44% year over year. Single-family homes authorized but not yet started were up nearly 39% year over year.
Builders will continue to try to put more inventory on the market, but they are significantly lagging demand, especially on the single-family front. This ongoing imbalance in supply and demand should continue to be supportive of home prices.
Jobless Claims Rise in Latest Week
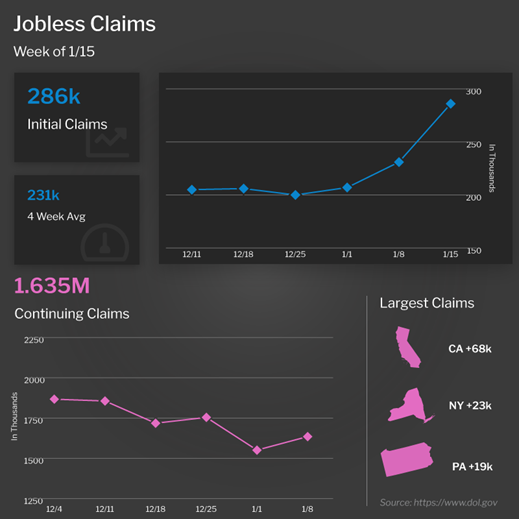
The number of people filing for unemployment benefits for the first time reached the highest level since October, as Initial Jobless Claims rose 55,000 to 286,000. If we compare Initial Claims to just a few weeks ago, they are almost 100,000 higher.
Omicron certainly could have played a role in this increase, but it’s also an important week to keep in mind. This data is for the “sample” week that gets plugged into the Jobs Report estimates. As a result, the January Jobs Report could show higher unemployment when it is released on February 4.
Continuing Claims, which measure people who continue to receive benefits after their initial claim is filed, rose 84,000 to 1.635 million.
There are now 2.128 million people in total receiving benefits, and while this is an increase of 180,000 in the latest week, it is still a stark contract to the nearly 17 million people receiving benefits in the comparable week the previous year.
Family Hack of the Week
This Thursday, January 27 is National Chocolate Cake Day. Mark the occasion in decadent style with this Chocolate Lava Cake recipe, courtesy of our friends at the Food Network.
Preheat oven to 425 degrees Fahrenheit. Spray 4 custard cups with baking spray and place on a baking sheet.
In a large bowl, microwave 1 stick unsalted butter, 2 ounces bittersweet chocolate and 2 ounces semisweet chocolate until butter melts, approximately 1 minute. Whisk until chocolate also melts.
Stir in 1 1/4 cups powdered sugar until well blended. Whisk in 2 large eggs and 3 egg yolks. Add 1 teaspoon vanilla and 1/2 cup all-purpose flour and blend well. Pour the mixture evenly into the custard cups.
Bake until the sides are firm but the centers remain soft, approximately 13 minutes. Remove from oven and let stand for 1 minute. Invert in individual bowls and enjoy warm with your favorite vanilla ice cream.
What to Look for This Week
More housing news is ahead this week, beginning Tuesday when the latest home price appreciation figures for November from the Case-Shiller Home Price Index and the Federal Housing Finance Agency (FHFA) House Price Index are reported. New and Pending Home Sales for December follow on Wednesday and Thursday, respectively.
Also on Thursday, the latest Jobless Claims figures will be reported as usual, along with December’s Durable Goods Orders and the first reading on fourth quarter GDP.
Friday brings the Fed’s favorite measure of inflation, Personal Consumption Expenditures, as well as Personal Income and Personal Spending for December.
And speaking of the Fed, their two-day FOMC meeting begins Tuesday, with their Monetary Policy Statement releasing on Wednesday and this always has the potential to move the markets.
Technical Picture
Mortgage Bonds continued to rebound on Friday but were rejected from the important ceiling of resistance at the 102.198 Fibonacci level. If they are able to break above this level, there is a lot of room to the upside. The 10-year has started to break beneath support at 1.77%, which is a good sign. The next floor is at 1.69%, which means there is quite a bit of room for improvement. We are also seeing a positive stochastic crossover in Mortgage Bonds and a negative stochastic crossover in 10-year yields, which means there is some momentum behind us where we could see continued improvement if we can maintain these levels.